
1. What Happened? – Google’s Own Crawl, Index and Serve Timings
At Google Search Central Live Deep Dive in Europe in early October 2026, Gary Illyes presented internal Google data on how long each stage of crawling, indexing and serving actually takes. Each process was given a typical time and a slowest time, drawn from Google’s own internal analysis.
The slides were photographed and shared by attendees — John Campbell and Neil McCarthy among them — and written up by Barry Schwartz. The figures below are as reported from those slides.
Crawling
| Process | Typical | Slowest |
|---|---|---|
| Discovery (new URL) | ~20 hours | Weeks to never |
| Refresh (known URL) | ~30 days | Weeks to never |
| Sitemap processing | ~24 hours | Up to 14 days, or never (quality) |
| robots.txt update | ~24 hours | 25 hours |
| Crawl capacity update | 4 hours to 1–2 weeks | 1–3 weeks (in recovery) |
| Crawl demand update | ~20 hours | Weeks to months |
Crawl capacity can drop in seconds when Google backs off — for example, if your server struggles.
Indexing
| Process | Typical | Slowest |
|---|---|---|
| Rendering | Seconds to render, hours in queue | Days to weeks |
| Meta annotations | 45–90 minutes | 1–4 days |
| Link annotations | Minutes to 1–3 weeks | Months |
| Indexing (end to end) | ~1.5 hours | Months or never (quality) |
| Removal | 1–3 weeks | Months |
| Canonicalisation change | 1–3 weeks | Months (conflicting signals) |
| Site move | 1–3 months | 6 months to 1 year+ |
| Structured data updates | Hours to 1–2 weeks | Weeks or never (quality) |
| Images | Hours to days | Weeks to months |
| Videos | Hours to days | Weeks to months |
Serving
| Process | Typical | Slowest |
|---|---|---|
| Removal in Search Console (owner) | ~2 hours | 24 hours |
| Snippet update | 1–2 days | Several weeks to months |
| Title update | 1–2 days | Several weeks to months |
| Text result image update | 1–2 weeks | Several weeks to months |
| Manual action removal | 1–2 weeks | 4–6 weeks, or much longer for dormant sites |
| Core update change | 3–6 months to recover | 6 months to 1 year (next core update) |
| Spam update change | 1–2 weeks (continuous) | Months (batch refreshes) |
Core updates take 2–4 weeks to roll out. Spam updates roll out in 1–2 days.
Two caveats that matter, stated up front
These are estimates, not commitments. The slides themselves say “times expressed on the diagram are estimations based on internal analysis.” Illyes added afterwards that the exercise was to see whether the audience could relate to numbers Google had pulled internally. Use them for planning, not for contracts or SLAs.
And the caveat that is actually the whole story. Illyes noted that many of these processes are linked — a page cannot be indexed until it has been crawled, so delays stack.
Everyone is republishing the tables. Almost nobody is going to do the stacking arithmetic. That is where the useful information lives.
2. Why Does It Matter? – Google’s Own Crawl, Index and Serve Timings
Discovery is 20 hours. Refresh is 30 days. That is a 36-fold gap.
These two numbers sit two rows apart on the same slide, and the distance between them quietly invalidates a large amount of standard SEO practice.
Google typically finds a brand-new URL in about 20 hours. It typically notices that an existing URL has changed in about 30 days.
Sit with that. Publishing is fast. Updating is slow — thirty-six times slower.
Every content refresh programme ever sold on “we’ll update your top 500 pages this quarter” is operating on a one-month default lag before Google even looks. Every “we fixed the issue, it should recover soon” conversation is wrong by about four weeks before anything else goes wrong. Every A/B test on title tags or on-page copy that reads results after a fortnight is measuring noise, because most of the test population has not been recrawled.
It also explains something we documented last week from the other direction. In our retail SERP analysis, an AI Overview quoted prices that did not match the merchants’ own listings on the same page. A thirty-day typical refresh on known URLs is one structural reason why: the price Google holds for your page can routinely be a month old.
The delays stack, and nobody is doing the arithmetic
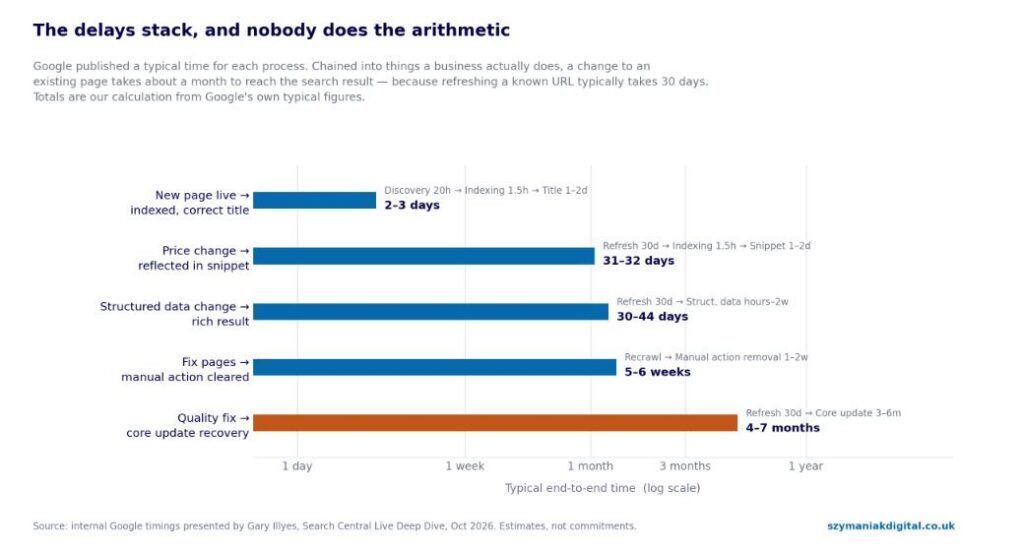
Take the typical figures and chain them into things a business actually does.
| What you are trying to do | The chain | Typical total |
|---|---|---|
| New page live → indexed with correct title | Discovery 20h → Indexing 1.5h → Title update 1–2d | 2–3 days |
| Price or content change on an existing page → reflected in the snippet | Refresh 30d → Indexing 1.5h → Snippet update 1–2d | 31–32 days |
| Structured data change → rich result | Refresh 30d → Structured data update hours to 2w | 30–44 days |
| Fix a quality problem after a core update decline | Refresh 30d → Indexing → Core update change 3–6m | 4–7 months |
| Fix pages and clear a manual action | Recrawl of fixed pages → Manual action removal 1–2w | 5–6 weeks |
The slowest column is bleaker and worth stating once, plainly. Chain the slowest values for that second row — “weeks to never”, then “months or never (quality)”, then “several weeks to months” — and the honest answer to “when will our price change show up?” is that it might not.
The one that should change your planning is the second row. A month, typically, for a change on an existing page to reach the snippet. Most organisations assume same-week. The gap between those two assumptions is where “I thought we fixed that” lives.
Damage is fast. Recovery is slow. The ratio is between five and sixty times.
Line up every paired process in the dataset:
| Event | Time to decline | Time to recover |
|---|---|---|
| Crawl capacity back-off | Seconds | 1–3 weeks |
| Spam update | 1–2 days to roll out | 1–2 weeks continuous, months for batch refreshes |
| Core update | 2–4 weeks to roll out | 3–6 months typical, up to 1 year |
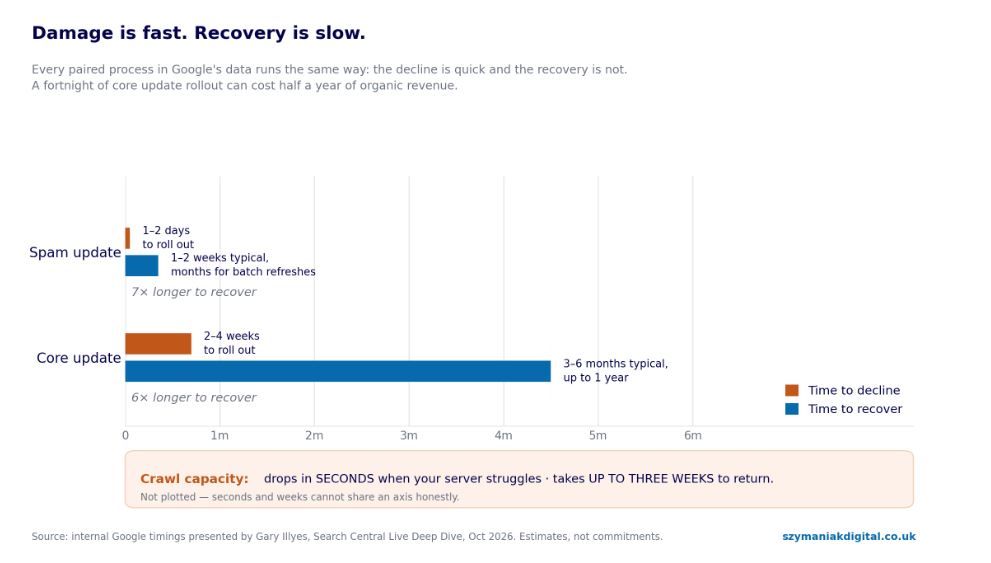
The crawl capacity line is the one to take to your infrastructure team. Google can withdraw crawl capacity in seconds if your server struggles, and returning it takes up to three weeks. A ten-minute incident during a sale, a migration or a bot surge is not a ten-minute problem. It is potentially a three-week crawl problem, during which every other number on these slides gets worse because nothing is being fetched.
SEO teams have argued for infrastructure investment on instinct for twenty years. This is the first time there is a published asymmetry to argue it with.
The core update line is the one to take to your board. Rolling out takes two to four weeks. Recovering takes three to six months, and can take a year because recovery often waits for the next core update. You can lose six months of organic revenue to something that happened over a fortnight.
“Never” appears three times, and always next to the word “quality”
Read the slowest column carefully:
- Indexing end-to-end: “months or never (quality)“
- Sitemap processing: “up to 14 days, or never (quality)“
- Structured data updates: “weeks or never (quality)“
Three independent processes, each with a terminal “never”, each gated on quality.
This is Google’s own data confirming something we analysed last week from a live case: a site that lost a whole page class to “Crawled – currently not indexed” with every technical check passing, covered in templated pages deindexed. “Never” is not a figure of speech or an edge case someone invented. It is a documented outcome at three separate stages.
It also means quality is not one gate at the end. Your sitemap can be deprioritised on quality. Your structured data can be ignored on quality. Your page can be permanently excluded on quality. A site can pass two of those and fail the third.
Your feedback loop is longer than your reporting cycle
This is the governance consequence, and it is the one a CMO needs.
If a change to an existing page typically takes a month to be seen, and a quality recovery typically takes four to seven months, then:
- Monthly reporting cannot evaluate most SEO work. The work has not been seen yet.
- Quarterly planning is shorter than the feedback loop on quality work. You will be asked to justify a programme before its first results are possible.
- Six-week test-and-learn cycles are measuring noise on anything involving existing pages.
- A new Head of SEO will be judged on their predecessor’s decisions for most of their first year.
None of that is a reason to do less. It is a reason to set the measurement window honestly at the start, because the alternative is a good programme being cancelled one month before it was ever going to show a result.
Two removal timelines that are not the same thing
Buried in the data is the single most useful fact here for a comms or legal team, and the two rows are nowhere near each other on the slides.
- Removal via Search Console (as site owner): ~2 hours typical, 24 hours slowest.
- Removal from the index: 1–3 weeks typical, months slowest.
These are different mechanisms. The Search Console removal tool suppresses a URL from results quickly and temporarily. Actual removal from the index takes one to three weeks.
In an urgent situation — a leaked page, a legal demand, a PR incident — you use the tool, in minutes, and then do the proper removal behind it. Teams that only know about the second number spend the first critical day believing nothing can be done.
3. Who Is Affected?
Ecommerce and anyone with changing prices. The 30-day refresh figure is your problem above all others. Prices, stock, promotions and delivery terms all change faster than Google typically notices.
Publishers and anyone running content refresh programmes. Your entire update strategy has a one-month typical lag built into it before any other factor. Worth knowing before you commit to a quarterly refresh target.
Any business planning a migration. Site move: 1–3 months typical, 6 months to 1 year or more at the slowest, with canonicalisation changes at 1–3 weeks stacking on top. We wrote about the organisational version of this problem in site migration: crawled, currently not indexed. Now there is a number to put next to it.
Large sites with crawl constraints. Discovery at ~20 hours and refresh at ~30 days are averages across Google, not promises to you. If your crawl capacity is already stretched, as covered in crawl budget for large aggregators, your real numbers are worse.
Anyone who has lost visibility to a core update. Three to six months typical recovery, up to a year. Plan, staff and fund accordingly, and say so now.
Businesses with manual actions. Removal at 1–2 weeks, but “much longer for dormant sites” — a detail worth noting if you are remediating something inherited, as in Google manual actions.
Engineering and infrastructure teams. The seconds-to-lose, weeks-to-regain crawl capacity asymmetry is your number. It belongs in your incident severity definitions.
Less affected: very small sites where crawl is not constrained, and sites publishing new content rather than updating existing content — discovery is the fast path.
4. What Should Businesses Do?
Four things: measure your own numbers rather than using Google’s, make changes easier to detect, sequence work so delays do not compound, and reset your planning windows.
4A. Everyone: measure your own refresh latency
Google’s figures are averages across the entire web. Yours will be different, and you can measure them.
This is the highest-value hour of work available from this announcement, and almost nobody will do it.
The method: for a sample of your URLs, compare when your CMS last changed the page against when Google last crawled it. The URL Inspection API returns lastCrawlTime; your CMS knows lastModified. The difference, across a few hundred URLs, is your real crawl lag distribution.
from datetime import datetime, timezone

def crawl_lag(inspection_result, cms_last_modified):
    """Days between your change and Google's most recent crawl.
       inspection_result: URL Inspection API response for one URL.
       Negative means Google has not been back since you changed it."""
    status = inspection_result['inspectionResult']['indexStatusResult']
    last_crawl = datetime.fromisoformat(status['lastCrawlTime'].replace('Z', '+00:00'))
    modified   = cms_last_modified.astimezone(timezone.utc)

    return {
        'last_crawl':   last_crawl,
        'last_modified': modified,
        'lag_days':     (last_crawl - modified).total_seconds() / 86400,
        'seen':         last_crawl > modified,
        'coverage':     status.get('coverageState'),
    }
Run it across a stratified sample — your highest-value pages, a middle band, and the tail — and report the median and the 90th percentile per template or directory. The API has a daily quota per property, so sample rather than attempting the whole site; check the current limit before you size the job.
What the output tells you:
- Median lag well under 30 days on your commercial pages: you are being crawled better than average. Protect it.
- Median lag well over 30 days: you have a crawl prioritisation problem, and every content change you ship is sitting unseen for longer than you assumed.
- A large gap between your top pages and your tail: normal and healthy, but it tells you where a change will and will not be noticed, which should direct where you spend effort.
- Pages where
seenis false weeks after a change: these are your blind spots. Nothing you did to them has reached search.
Re-run quarterly. This number belongs on the standing dashboard next to the answer capture ratio from our query-shape analysis — both measure the distance between what you did and what Google actually registered.
4B. For the content and marketing team: plan around the lag rather than against it
Set measurement windows at the start of every piece of work, and write them into the brief. New page: expect indexing in days, meaningful performance data in weeks. Change to an existing page: expect nothing for a month. Quality programme after a core update: four to seven months. Putting this in the brief protects good work from being cancelled during the gap.
Batch changes to existing pages; do not dribble them. If a template is going to be recrawled on roughly a monthly cycle, ship everything you want evaluated in one release rather than across four weekly ones. Four small releases means four separate recrawl waits.
Prioritise refreshes by crawl frequency, not only by traffic. Use the 4A data. A page Google visits weekly will reflect your change in a week. A page it visits quarterly will not. Of two pages with equal value, update the one that will actually be seen.
Get titles and meta descriptions right at publication. Title updates are 1–2 days typically but “several weeks to months” at the slowest — and that clock starts after the recrawl. On an existing page, a title change can easily be a six-week round trip. Treat them as expensive to change rather than as a quick test.
Stop running short on-page tests on existing pages. A two-week test where most of the population has not been recrawled measures nothing. Either extend the window past your measured median lag, or test on new pages where discovery is twenty hours.
Separate “new” and “updated” in your content roadmap. They have different timelines, different risks and different reporting cadences. Most content calendars treat them as the same unit of work, which is why forecasts miss.
4C. For the development team: make changes cheap to detect and fast to re-fetch
You cannot force a recrawl. You can make it dramatically easier for Google to tell what changed, which is what the refresh figure is ultimately gated on.
Serve accurate Last-Modified headers and support conditional requests. Answering If-Modified-Since with a 304 Not Modified costs almost nothing and leaves crawl capacity for the pages that did change.
js
// Conditional responses: cheap for unchanged pages, honest for changed ones.
function handle(req, res, page) {
  const lastModified = page.contentUpdatedAt;        // real content change only
  const etag = `"${page.contentHash}"`;              // not a build or deploy hash

  res.set('Last-Modified', lastModified.toUTCString());
  res.set('ETag', etag);

  const since = req.get('If-Modified-Since');
  const noneMatch = req.get('If-None-Match');

  const unchanged =
    (noneMatch && noneMatch === etag) ||
    (since && new Date(since) >= new Date(Math.floor(lastModified / 1000) * 1000));

  if (unchanged) return res.status(304).end();
  return res.status(200).send(page.html);
}
The discipline that makes this work: Last-Modified must track content changes, not deployments. A site that stamps every page with the last build time tells Google everything changed every Tuesday, which means Google learns the signal is worthless and stops using it. Hash the rendered content, not the release.
Keep sitemap lastmod honest for the same reason. An accurate lastmod is a useful hint; a lastmod that updates on every deploy is noise that gets discounted.
Ship a “recently changed” sitemap. Maintain a small, separate sitemap containing only URLs genuinely changed in the last fourteen days, listed in your sitemap index alongside the full set. A short, high-signal file is a far stronger prompt than one line changing inside a 50,000-URL sitemap.
js
// A small, honest, high-signal sitemap of genuine recent changes.
function recentlyChangedSitemap(pages, windowDays = 14, max = 1000) {
  const cutoff = Date.now() - windowDays * 86400_000;
  const recent = pages
    .filter(p => p.contentUpdatedAt.getTime() > cutoff)   // content, not deploy
    .sort((a, b) => b.contentUpdatedAt - a.contentUpdatedAt)
    .slice(0, max);

  const urls = recent.map(p => `  <url>
    <loc>${p.url}</loc>
    <lastmod>${p.contentUpdatedAt.toISOString()}</lastmod>
  </url>`).join('\n');

  return `<?xml version="1.0" encoding="UTF-8"?>
<urlset xmlns="http://www.sitemaps.org/schemas/sitemap/0.9">
${urls}
</urlset>`;
}
Protect crawl capacity like the perishable asset it is. Capacity drops in seconds on server strain and takes up to three weeks to return. That means:
- Treat sustained 5xx rates and response-time spikes as crawl incidents, not just availability incidents.
- Add crawl capacity recovery to your incident post-mortems — the outage ended on Tuesday, the crawl consequence did not.
- Never load-test, migrate or run a heavy batch job against production during a period when indexing speed matters.
- Make sure bot protection is not throttling verified crawlers
Do not change everything at once. Canonicalisation changes take 1–3 weeks on their own and “months” where signals conflict. Changing URLs, canonicals, internal linking and content in a single release means the slowest process gates all of them and you cannot tell which one caused what. Sequence: structure first, let it settle, then content.
Reduce crawl waste so refresh capacity reaches pages that matter. Faceted URL explosion, infinite parameter space and soft 404s all consume the same budget that would otherwise re-fetch your product pages.
Instrument the whole chain. Log content-change time, first subsequent crawl, index status change and serving change per URL. Once you have that, you own your real numbers rather than Google’s averages, permanently.
4D. Rolling it out
- Run the 4A measurement on a sample. One day’s work, and it reframes everything below.
- Publish your real numbers internally — median and 90th percentile crawl lag by template. This is the slide that changes the conversation.
- Fix
Last-ModifiedandETagso they track content, not builds. Highest-leverage engineering task here. - Ship the recently-changed sitemap.
- Audit for honest
lastmodacross the full sitemap set and fix deploy-stamped dates. - Add crawl capacity to incident severity definitions and to post-mortems.
- Rewrite your content brief template to carry an explicit measurement window.
- Re-sequence any in-flight migration so structural and content changes are separated.
- Reset the forecast for anything currently in core update recovery.
- Re-measure quarterly and chart your lag against Google’s published typicals.
4E. Governance
Put the measurement windows in writing, before the work starts. The single most destructive pattern in SEO is a programme cancelled during the period when, by Google’s own figures, no result was possible. Agree the window at the start and the argument never happens.
Change the reporting cadence to match the mechanism. Monthly reporting for new content, quarterly for changes to existing pages, and a separate longer horizon for core update recovery. One cadence for all three guarantees two of them are reported meaninglessly.
Make crawl capacity an engineering SLO. It is the only item on these slides where the business can inflict damage on itself in seconds, and it currently belongs to nobody.
Brief your comms and legal teams on the two removal paths. Two hours versus one to three weeks. That difference matters most on the day nobody has time to look it up, so it belongs in the runbook now.
Treat these numbers as planning estimates, not entitlements. They are internal Google estimates presented at a conference, not a service commitment. Use them to set expectations; do not put them in a contract, and do not let a vendor promise them.
5. What We’re Watching Next
Whether the 30-day refresh figure holds as crawl economics tighten. Crawl capacity is now shared across far more demand than it was — AI training crawlers, shopping feeds, agent traffic. If total capacity is under pressure, refresh is the first thing to stretch, because re-fetching a known page is the most deferrable work Google does. We would watch your own measured number rather than this published one.
Whether Google publishes any of this officially. These figures came from conference slides, were photographed by attendees and were explicitly framed as an exercise in whether the audience could relate to internal numbers. That is a long way from documentation. If any of it reaches Search Central’s docs, it becomes something teams can plan against with more confidence.
Whether core update recovery timelines shorten. Three to six months typical, with recovery frequently waiting on the next core update, is the single most commercially damaging number on these slides. It is also the one Google has most often signalled a desire to improve.
How the refresh lag interacts with answer surfaces. If Google’s copy of your page is typically a month old, every answer generated from it is working from month-old facts. We measured the symptom in our retail SERP analysis — AI Overview prices contradicted by merchants’ own listings on the same page. These slides supply a plausible mechanism. Whether answer surfaces get a faster refresh path than classic indexing is, for commercial sites, the most important open question here.
Whether anyone publishes measured real-world numbers at scale. Google has given us typicals. Nobody has yet published the actual distribution of crawl lag across a large sample of real sites. That study is eminently doable with the method in 4A, and we intend to run it.
6. About Szymaniak Digital
Szymaniak Digital is an enterprise AI SEO consultancy. A great deal of what we do is closing the gap between what a team believes it has changed and what Google has actually registered – because those are rarely the same thing, and until this week most of the industry was guessing at the size of the difference.
If you do not currently know your own median crawl lag, you do not know how long any of your SEO work takes to land. That measurement is where we would start