
1. What Happened? – Zero Click Searches in 2026 – The Answer Capture Ratio
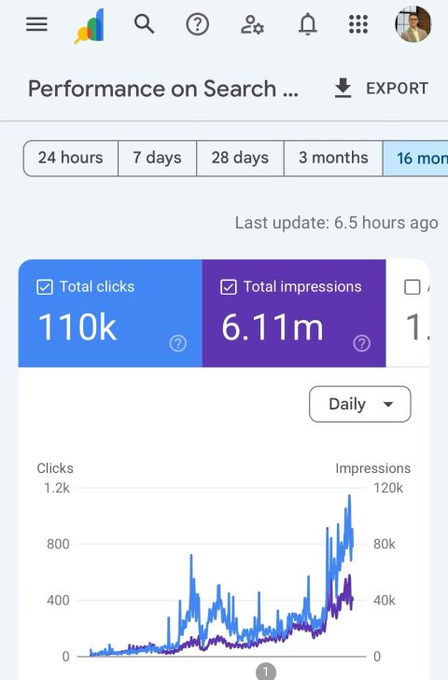
We pulled a full query export for one of the information-led sites in our portfolio: 54,614 unique queries, 1,665,290 impressions, 30,448 clicks, across 2026.
Then we cut it by a dimension almost nobody reports on. Not by page, not by position, not by device. By the grammatical shape of the query – whether the search was phrased as a question or not.
The result is the clearest picture we have seen of what has actually happened to organic search this year.
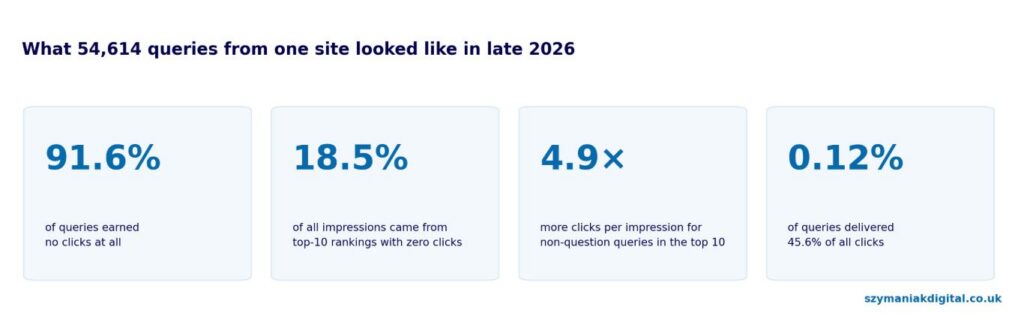
At the same average position, question-shaped queries earned 4.9 times fewer clicks per impression than everything else.
Not 10% fewer. Not 30% fewer. A fifth. And the two groups were ranking in effectively the same place — average position 6.52 for questions against 5.98 for non-questions, within the top ten. Half a position of difference cannot produce a fivefold gap in click-through.
Then the finding that tells you why. We split the comparison by position band:
| Average position | Non-question CTR | Question CTR | Gap |
|---|---|---|---|
| 1–3 | 8.88% | 1.41% | 6.3x |
| 3–5 | 4.21% | 0.80% | 5.2x |
| 5–10 | 1.30% | 0.33% | 3.9x |
| 10–20 | 0.75% | 0.16% | 4.8x |
| 20+ | 0.21% | 0.08% | 2.5x |
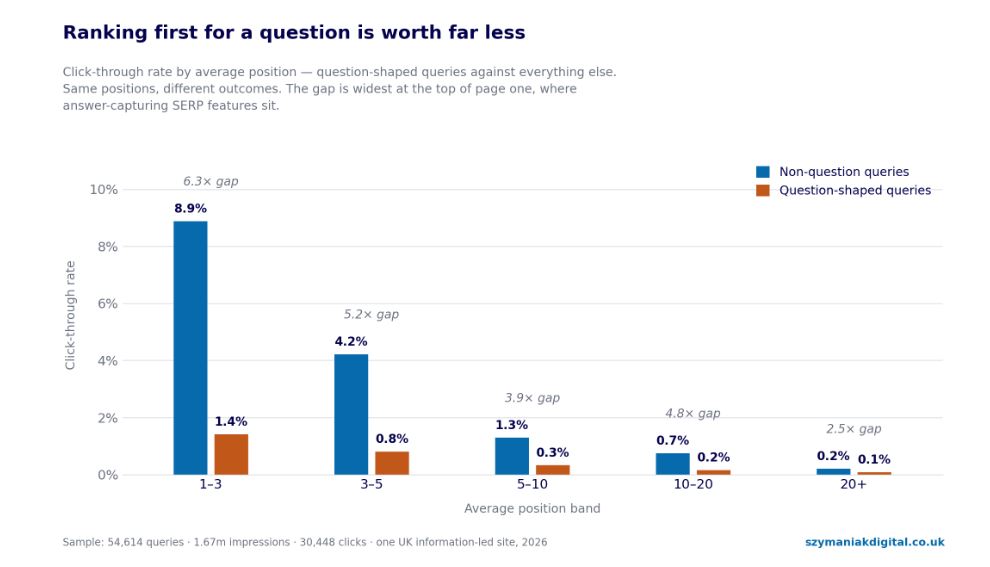
The penalty is worst at the top of page one and mildest at the bottom of the results.
That direction matters more than the headline number, and it is the whole argument. If question-shaped queries simply attracted worse-matched traffic, or drew more idle browsers, the gap would be roughly flat across positions, or worse at the bottom where intent is weakest. It is not. It is concentrated precisely where AI Overviews, featured snippets and People Also Ask sit.
The page is answering the question above you. Ranking first for a question now means being the source for an answer the user never needs to click.
We call the ratio between those two numbers the answer capture ratio: non-question click-through divided by question click-through, measured inside a single position band so that ranking is held constant. On this site, at positions one to three, it is 6.3.
It is a number you can calculate on your own Search Console export this afternoon. Section 4 shows you how.
2. Why Does It Matter? – Zero Click Searches in 2026 – The Answer Capture Ratio
It explains the argument your SEO team keeps losing
Every marketing director has now had this meeting. The SEO lead presents improved rankings and growing impressions. The analytics lead presents flat or falling organic sessions. Each has correct data. Each suspects the other of spin.
They are both right, and the answer capture ratio is the missing variable. Rankings improved. Impressions grew. The commercial value of each of those impressions fell, unevenly, concentrated in exactly the queries a content team is most likely to have been told to target.
Until you measure the gap, the argument is unresolvable and the budget decision gets made on whoever presents more confidently.
“Visibility” has quietly stopped meaning what it used to
On this site, 91.6% of queries earned no clicks at all. Those silent queries carried 34.3% of all impressions.
More pointedly: 40,048 queries ranked in the top ten and produced zero clicks between them — 307,809 impressions, 18.5% of everything the site earned all year.
That is not page-two invisibility. That is first-page presence converting to nothing.
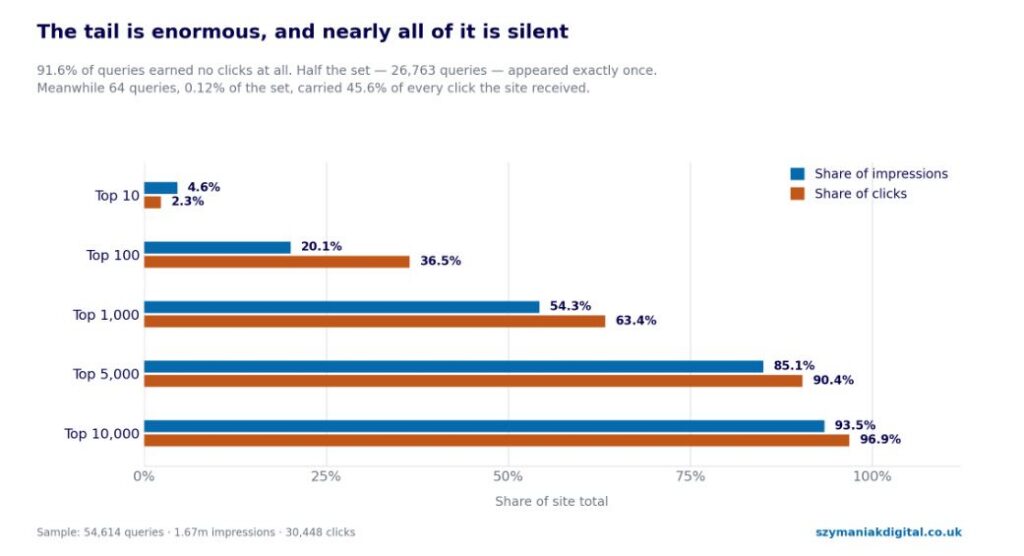
Meanwhile the clicks that did arrive were brutally concentrated. 64 queries — 0.12% of the set — carried 45.6% of all clicks. 425 queries, under 1%, carried 68.7%. Half the query set, 26,763 queries, appeared exactly once all year.
A visibility metric that counts all of that equally is not measuring anything a business can spend.
It is not questions that lose clicks — it is answerable ones
The grammatical cut is a proxy, and the finer cut is more useful. Splitting by opening phrase:
| Opening phrase | CTR |
|---|---|
| “how much…” | 0.13% |
| “how many…” | 0.13% |
| “do you…” | 0.14% |
| “what is…” | 0.24% |
| “what are…” | 0.34% |
| “how to…” | 0.38% |
| “is it…” | 0.79% |
| “what do…” | 1.14% |
| “can you…” | 1.18% |
| “how do…” | 1.63% |
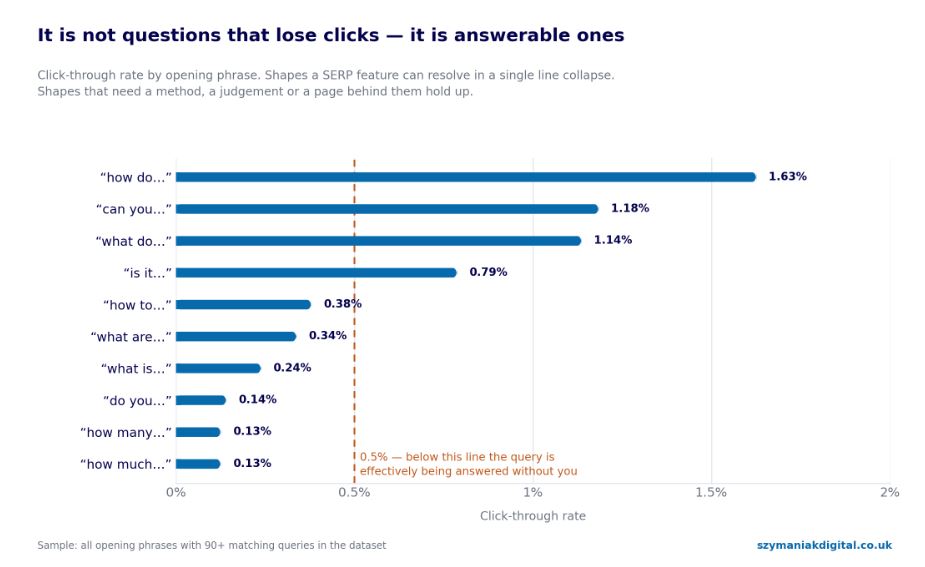
A twelvefold spread inside the same grammatical category. The pattern is not question versus statement. It is resolvable in one line versus not.
“How much” and “how many” ask for a number. A number fits in a snippet, in an AI Overview, in a People Also Ask accordion. Those queries are now worth roughly a tenth of a percent. “How do” asks for a method, which needs sequence, context and judgement, and still earns 1.63% — more than twelve times as much.
This is the single most actionable finding in the dataset, because it is a commissioning rule. The brief that says “target question keywords, they are conversational and AI-friendly” has been wrong for at least a year, and this is the evidence.
Long-tail content is ranking better and earning less
Sorted by query length, the site ranks better on longer queries and converts them worse.
| Words | Avg position | CTR |
|---|---|---|
| 1–2 | 13.9 | 2.02% |
| 3–4 | 12.8 | 1.81% |
| 5–6 | 8.4 | 1.88% |
| 7–8 | 9.3 | 1.09% |
| 9+ | 8.7 | 0.41% |
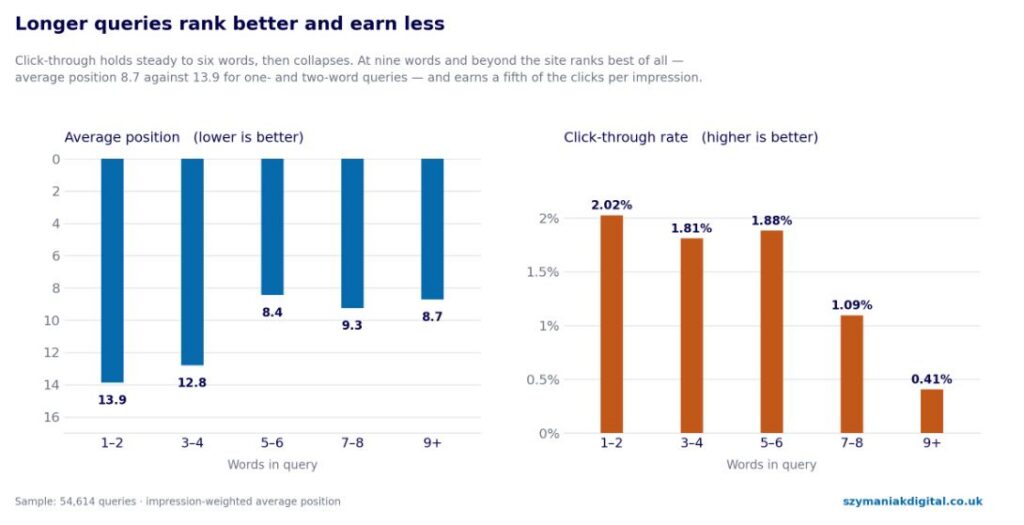
Click-through holds up to six words, then falls off a cliff. At nine words and beyond the site achieves its best average position of any band — 8.7 against 13.9 for one- and two-word queries — and earns a fifth of the clicks per impression.
Every long-tail content programme built on “rank for the specific thing” is being graded on the wrong metric. The ranking arrived. The traffic did not.
Brand is now carrying the commercial load
33 brand queries — 1.07% of impressions — delivered 30.4% of all clicks, at a 52.0% click-through rate. Every other query on the site, all 54,581 of them, converted at 1.3%.
A brand impression was worth roughly forty times a non-brand impression on this site.
That is the real argument for brand investment in 2026, and it is not a branding argument. It is an arithmetic one. When the answer layer absorbs unbranded informational demand, the queries that survive are the ones where the user has already decided who they want to hear from.
3. Who Is Affected?
- Publishers and information-led businesses. Hardest hit, and this sample is one of them. If your model is “rank for the question, monetise the visit”, the question half still works and the visit half is being intercepted.
- Professional services — legal, finance, accountancy, healthcare, consultancy. Your market researches in questions. “What is”, “how much”, “do I need to” — precisely the shapes collapsing fastest. The partner who asks why the firm’s excellent FAQ content generates no enquiries now has an answer.
- Education, training and admissions. Eligibility, requirements, deadlines and scores are exactly the one-line-resolvable facts the SERP now answers directly. Note the temporal finding: on this site, queries naming the current year converted at 3.83% while queries naming the previous year converted at 0.99% and next year’s at 0.96%. Currency is doing real work.
- Ecommerce, in a different shape. Product and category queries are mostly not question-shaped, so the headline gap applies less. But “how much is”, “does it come with”, “is it compatible with” are being resolved in the SERP and increasingly by agents — which is the same mechanism arriving through a different door, as we covered in Gemini 4 Argon as an SEO guide.
- SaaS and B2B technology. Documentation and comparison content built around “what is” and “how does X work” is deep in the collapsing band. “How do I” and “can I” content is holding.
- Anyone whose SEO reporting leads with impressions, average position, or “keywords ranking in the top 10.” Those three metrics have each, independently, decoupled from revenue. Reporting built on them will now show improvement during a commercial decline.
- Less affected: transactional and navigational demand, local search with a physical visit at the end, and anything where the user must reach your site to complete the action. The answer layer can describe a thing; it cannot yet be the thing.
4. What Should Businesses Do?
The work splits cleanly: measure the gap, change what you commission, change what the site gives a machine to work with, and change what you report.
4A. Everyone: calculate your own answer capture ratio
Do not take our number. Ours is one site in one sector. The method generalises; the figure does not. Run it on your own export — it takes under an hour and it will be the most useful hour your team spends this quarter.
- Export all queries for the last 12 months, with clicks, impressions, CTR and position.
- Flag every query beginning with a question word: what, how, why, when, where, who, which, can, do, does, is, are, should, will, would, could, if.
- Filter to rows with an average position of 10 or better. This is the step most people skip, and it is the one that makes the finding defensible — it removes ranking as an explanation.
- Within that filtered set, calculate total clicks divided by total impressions, separately for the question group and the non-question group.
- Divide the non-question CTR by the question CTR. That is your answer capture ratio.
- Repeat for the position bands 1–3, 3–5 and 5–10 separately, and look at the shape. A ratio that is highest at 1–3 is the signature of answer capture. A flat ratio across bands points to an intent or relevance problem instead, which is a different diagnosis with a different fix.
Then run the same cut by opening phrase — “how much”, “how many”, “what is”, “how do”, “can I” — and rank them. That list is your commissioning brief for the next twelve months.
Record the number and re-run it quarterly. A single reading tells you where you are. The trend tells you how fast the ground is moving, and it is the only version of this that survives a board meeting.
4B. For the content and marketing team: commission against the ratio, not the volume
Stop briefing content against question keywords by default. The instruction to “target questions because that is how people search now” is producing impressions and not clicks. Every brief that names a target query should carry that query’s band from your own analysis.
Apply the resolvability test before commissioning anything. Ask one question of every proposed target: can a correct answer to this be written in one sentence? If yes, a SERP feature will write it, and you will not get the click. That does not mean never covering it — it means never making it the primary objective of a page, and never counting its impressions as a win.
Shift the mix towards what cannot be resolved in a line. Method and sequence, where order and judgement matter. Trade-offs where the honest answer is “it depends, and here is how to decide”. Applied specifics — your pricing, your process, your eligibility, your data. Original research nobody else holds. Anything requiring a tool, a calculation or an account.
Note what these have in common: they are all things an answer layer must cite rather than absorb, because the substance lives with you.
Keep covering the collapsing queries — but as supporting structure, not as destination pages. A “what is” definition belongs as a clearly marked opening section inside a substantial page, where it establishes relevance and feeds the answer layer. It no longer justifies its own URL, its own brief, or a line in the forecast.
Treat currency as a ranking-adjacent asset. Current-year queries converted at nearly four times the rate of adjacent-year queries on this site. Keep dated content genuinely current, visibly dated, and updated in place rather than republished at a new URL.
Build the brand term deliberately. When a brand impression is worth forty unbranded ones, brand search is not a vanity metric, it is the most efficient line in the acquisition model. The content that builds it — original research, named viewpoints, genuine expertise, consistent publication — is also the content that survives answer capture. The same investment solves both problems, which is a rare thing and worth saying out loud in a budget meeting.
4C. For the development team: make the machine-readable version worth citing
If a meaningful share of your impressions now resolve without a visit, the question is no longer only “how do we get the click”. It is also “when we are read and not visited, is the business represented correctly”.
Mark up the facts an answer layer will lift anyway. Price, availability, eligibility, specification, opening hours, return terms, author and organisation credentials. If a system is going to answer on your behalf, the alternative to supplying a structured, accurate, attributable version is letting it infer one.
Keep structured data and visible content identical. Divergence is both a manual action category and a direct cause of misrepresentation, as we covered in Google manual actions.
Front-load the facts. Put the definitive statement, the number, the specification near the top of the page and the top of each section. This serves human skimmers, extraction systems and long-context retrieval equally.
Make the heading structure match the real question structure. One question per heading, answered immediately beneath it, with proper hierarchy. This is the cheapest extraction improvement available and most sites still fail it.
Keep URLs stable and content updated in place. Republishing at new addresses discards accumulated authority at the exact moment authority is doing more work than ranking.
Confirm that legitimate crawlers and assistants can actually reach you. Bot protection that blocks them removes you from the answer layer altogether — a worse outcome than being cited without a click. The verification principle in Googlebot blocked with 403 applies to every crawler, and the measurement gap is covered in Adobe bot detection exceptions.
Instrument the query-shape cut properly. Pull the Search Console API into your warehouse, flag query shape at ingest, and make the answer capture ratio a standing field rather than a quarterly spreadsheet exercise. It is three lines of logic and it turns a one-off finding into a monitored metric.
4D. Rolling it out
- Run the ratio. One analyst, one afternoon, your own export.
- Run it by opening phrase and rank your top twenty shapes by CTR.
- Present both to the leadership team before changing anything. This is the number that settles the rankings-versus-sessions argument, and it lands far harder than any recommendation that follows it.
- Audit the content pipeline against the resolvability test. Expect to kill or restructure a meaningful share of what is already briefed.
- Rewrite the commissioning template so every brief carries its target’s band.
- Fix the structured data and heading structure on your highest-impression zero-click pages first — they are where the capture is happening.
- Re-point the reporting per 4E.
- Re-run the ratio quarterly and chart the trend.
4E. Governance: retire the metrics that now mislead
This is the part that requires authority rather than effort, and it is the part most organisations avoid.
Stop reporting “keywords in the top 10” as a headline. On this site, 40,048 top-ten queries produced zero clicks. The metric is not wrong, it is just no longer connected to anything commercial.
Stop reporting impressions without a segment. Total impressions can rise while commercial impressions fall, and on this evidence that is the likeliest thing to be happening.
Report clicks, and report them split by query shape. One line for resolvable-question demand, one for everything else. The two now behave differently enough that averaging them hides the story.
Add the answer capture ratio to the standing dashboard with its trend. It is the one number that tells a board whether the ground is still moving.
Set the expectation honestly with whoever owns the forecast. If a meaningful share of informational demand is being answered without a visit, organic session targets built on historic click-through curves are already wrong. Better to reset them deliberately now, with evidence, than to miss them quarterly and litigate why.
5. What We’re Watching Next
Whether the gap keeps widening at the top of the page. The 6.3x figure at positions one to three is the one to track. If it climbs while the 20+ figure holds, the mechanism is confirmed and intensifying. If it flattens, the answer layer has reached its natural ceiling for this kind of demand. Our next cut of this analysis will say which.
Whether “how to” follows “what is” down. On this site “how to” sits at 0.38% while “how do” holds at 1.63% — same intent, different phrasing, four times the outcome. We read that as procedural content being partially captured and not yet fully. That boundary is the one to watch, because it is where most practical content sits.
Whether brand concentration deepens. A 40x gap between brand and non-brand impression value is already extreme. If it widens, the strategic conclusion is uncomfortable but clear: unbranded informational SEO becomes a brand-building activity measured on assisted outcomes, not a traffic channel measured on sessions.
Whether the measurement catches up. No mainstream reporting tool currently segments click-through by query shape, which is why this gap has stayed invisible for so long inside dashboards that otherwise look healthy. We expect that to change, and until it does the advantage sits with teams who calculate it themselves.
What the same cut looks like with a date dimension. The analysis here is aggregate across the period. Running it month by month would show whether the ratio is accelerating and when it stepped — which is the version that would let a business attribute the change to specific SERP shifts. That is our next piece of work and a part of a wider in-house system building, so our clients can benefit from this too!
6. About Szymaniak Digital
Szymaniak Digital is an enterprise AI SEO consultancy. We work with senior marketing teams whose rankings are improving and whose organic revenue is not, and we spend most of our time on the gap between those two facts.
The analysis in this article took an afternoon and uses nothing but a Search Console export. If your reporting currently leads with impressions, average position or top-ten keyword counts, running it will change what your next board deck says. Book a search visibility review and we will run it with you.