
House Prices Chelsea in Google AI Mode: Who Wins & Why
By Konrad Szymaniak, Founder & Enterprise AI SEO Consultant, Szymaniak Digital
We pulled a single, high-intent local query through Google’s AI Mode – “what are the house prices in Chelsea?” – and reverse-engineered the entire answer: every source cited, every source silently used to ground the response, and the sub-questions Google generated behind the scenes. The result is one of the cleanest worked examples we’ve seen of how AI Mode actually decides who gets named, who gets used, and who gets left out.
What happened? House Prices Chelsea in Google AI Mode: Who Wins & Why
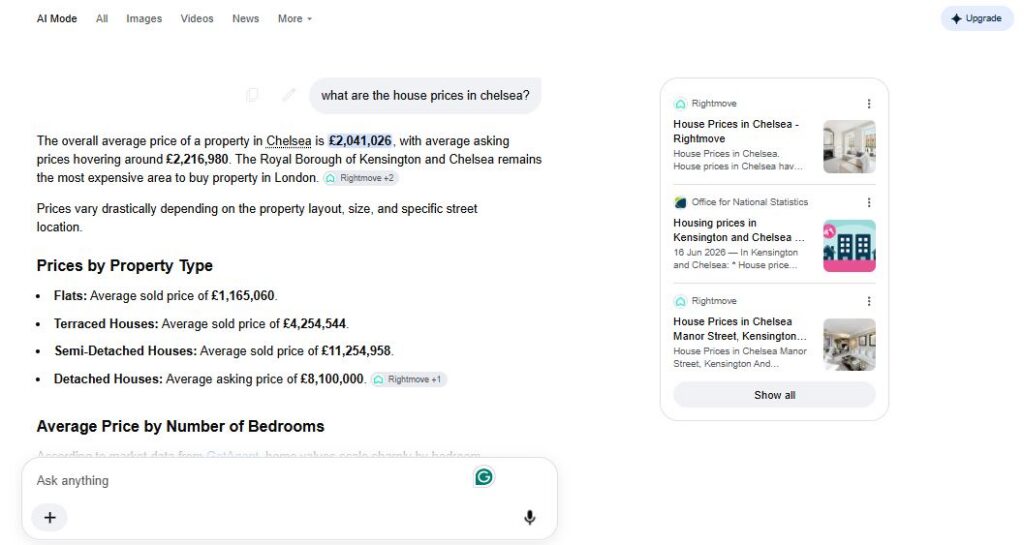
Search the phrase “what are the house prices in Chelsea?” in Google’s AI Mode (the udm=50 experience) from a UK desktop, and Google no longer hands you ten blue links. It composes a full, structured briefing.
In our capture it opened with a headline figure – an overall average property price of £2,041,026 and average asking prices around £2,216,980 – anchored to the claim that the Royal Borough of Kensington and Chelsea remains the most expensive place to buy in London. It then broke the market down by property type (flats at £1,165,060, terraced houses at £4,254,544, semi-detached at £11,254,958, detached asking prices near £8,100,000), by bedroom count (from £853,867 for a one-bed up to £7,991,000 for a five-bed), and by market trend – a roughly 14.7% correction over the year, prices about 19% below the 2022 peak of £2,511,883, a striking micro-location spread from £18.6m on Chelsea Square down to £635,000 on Chelsea Manor Street, and an average time on market of 22 weeks.
Screenshot 1
Screenshot 2
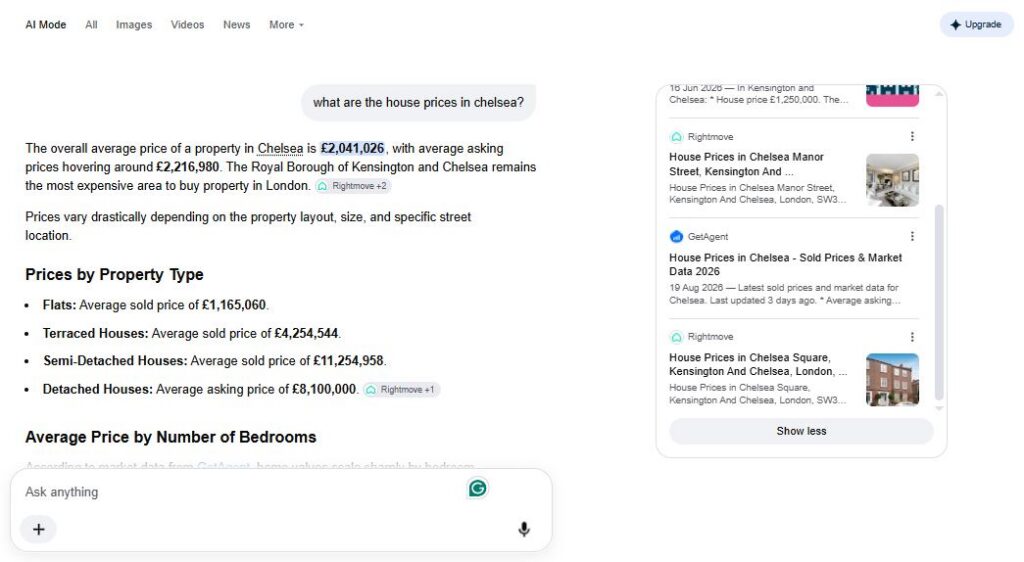
None of that is Google’s own data. Every figure is lifted, with attribution, from a small portfolio of third-party sources. Inline, the answer cited Rightmove (its Chelsea area page plus individual street-level pages for Chelsea Square and Chelsea Manor Street), GetAgent (for the bedroom-level breakdown, the asking price, and the time-on-market stat), and the Office for National Statistics (for the borough-level context). The reference carousel on the right surfaced the same trio, and our scraper caught GOV.UK’s UK House Price Index and Zoopla in the wider reference set behind the visible answer.
The most revealing layer sits underneath. The grounding metadata Google generated to build this answer – the fan-out – shows Gemini was fed and asked to reconcile not just the portals and government data, but interpretive sources the average searcher never sees named: a Fox Davidson market-analysis blog (price-per-square-foot and the correction narrative), a Samakbay 2026 outlook piece, and a MoneyWeek article carrying Savills’ forecast that prime central London prices will fall around 2% in 2026 before flattening. Google didn’t run one query. It ran a cluster – current average house prices Chelsea London 2026, Chelsea property market trends 2026, property market report Chelsea London 2026, and several more – and assembled the winning sources for each slice into one answer.
Why does it matter? House Prices Chelsea in Google AI Mode: Who Wins & Why
The old contest was singular: rank one URL for one keyword and win the click. AI Mode has quietly replaced that with a portfolio contest. The query splinters into a fan of sub-questions, each is answered from whichever source owns that specific slice best, and the “winner” is whoever appears across the most slices with the cleanest, freshest, most extractable fact. You are no longer trying to rank a page. You are trying to become the sentence Google reaches for.
That changes the economics of visibility in three concrete ways. First, the prize is now the cited fact, not the ranked link – and citation is winner-takes-most. Rightmove wasn’t referenced once; it was woven through the overall average, the property-type table, and the location-premium examples, because it owned a canonical page and granular supporting pages. Second, being large is no longer sufficient. Zoopla is one of the biggest property portals in the UK, yet in this capture it sat in the reference set without making the composed answer, while GetAgent – a fraction of the domain authority – won the bedroom-level and time-on-market slices outright because its data was structured and current. Third, and least understood: the sources Google grounds on are broader than the sources it shows. Specialist blogs and forecast pieces fed the narrative and the outlook even though they never appeared in the tidy citation carousel. Visibility in AI Mode is a two-tier system, and most brands are only measuring the top tier.
For any business competing on informational or “near me” queries with a statistical or price dimension, this is the whole game now. “The commercial value has moved from the ranked position to the cited fact,” as we put it to clients. If your data isn’t structured to be lifted cleanly, dated to prove it’s current, and mapped to the specific sub-questions Google generates, you are invisible in the answer even when you rank on the traditional page beneath it.
Who is affected? House Prices Chelsea in Google AI Mode: Who Wins & Why
Property portals and estate agents are the front line, and this query shows the fault line clearly. National portals win the raw-number slices through sheer coverage of canonical and street-level pages. Independent agents and challenger brands, by contrast, are being handed an opening on the interpretive slices — forecasts, “is it a good time to buy,” “are prices falling” — that the portals largely don’t publish. That gap is exactly where a smaller, expert brand can earn citations it could never win on domain strength alone.
Local-service businesses of every kind face the same mechanic. Any query that blends a place with a number — average costs, typical prices, local rates, “how much is X in Y” — will fan out into the same portfolio contest. Winning it depends on owning granular, location-specific, well-structured data rather than a single generic service page.
Financial services, mortgage, and comparison brands inherit a trust dimension. Notice that Google reached for the ONS and GOV.UK’s House Price Index to anchor its factual, borough-level claims. For anything money- or health-adjacent, AI Mode visibly leans on authoritative, ideally governmental, sources for the load-bearing statistics — so alignment with, and corroboration of, official data becomes a citation strategy, not just a compliance nicety.
Data publishers and content-led specialists are the surprise beneficiaries. Fox Davidson, Samakbay and MoneyWeek/Savills didn’t win on scale; they won on owning interpretation the portals leave on the table. For any B2B, SaaS, healthcare or finance brand sitting on proprietary insight, benchmarks or forecasts, that is the most encouraging signal in this entire teardown: the interpretive layer is winnable with expertise, not just authority.
What should businesses do?
The method that falls out of this capture is repeatable, and it’s the same one we run inside Szymaniak Digital’s A.G.E.N.T. Framework for agentic search. Six moves, in order.
- Map the fan-out before you write a word. Reverse-engineer the sub-questions Google generates for your target query — the way we surfaced current house prices Chelsea 2026, market trends 2026, property market report 2026 and the rest here. Our Prompt Portfolio Mapping process turns that fan of sub-queries into a content brief, so you build against the questions Google is actually asking rather than the one keyword you think you’re chasing.
- Build the canonical entity page, then the granular supporting pages beneath it. Rightmove wins because it holds both a definitive “House Prices in Chelsea” page and street-level pages that let AI Mode answer the location-premium sub-question with real examples. One authoritative hub plus specific child pages (by postcode, street, bedroom count, property type) covers more slices of the fan-out than any single page ever could.
- Structure every fact to be lifted. Clean stat blocks, unambiguous headings that mirror the sub-questions, semantic HTML, and
Dataset/structured-data markup so a model can extract a single figure with confidence and attribute it back to you. If your key number is trapped in a sentence or an image, it won’t be cited. - Own the interpretive layer the portals ignore. This is the challenger’s route in. Portals publish numbers; they rarely publish forecasts, “is now a good time to buy,” or a genuine market-report narrative. In one of our live content design briefs for a prime-central-London estate agent, the winning structure deliberately targets exactly those gaps — a Chelsea forecast for 2026/2027, an honest “are prices falling?” section, a “is it a good time to buy?” answer — because that is where a specialist brand out-earns Rightmove on citations rather than fighting it on raw coverage.
- Run a freshness cadence. GetAgent’s “last updated 3 days ago,” the ONS’s June 2026 dating, the 2026-dated forecasts — recency is a visible citation signal for any query whose correct answer changes monthly. Stamp your data, refresh it on a schedule, and make the update date machine-readable.
- Corroborate the authorities, then measure your citation share. Anchor your load-bearing statistics to ONS and Land Registry data so your figures agree with the sources Google already trusts, and pair that with clear author-level expertise (E-E-A-T) on the interpretive content. Then track the outcome: our Search Discovery Monitoring and AI Recommendation Score tell you which sources AI Mode is citing for your priority queries over time, so citation share becomes a KPI you can actually move – not a black box.
The through-line is simple. Stop optimising for a position and start optimising to be the extracted, attributed fact – across as many slices of the fan-out as your expertise and data will let you own.
What we’re watching next
- We expect grounding metadata to become the new rank tracking.
The list of sources a model uses — not just the ones it shows — is the real scoreboard, and the tools and teams that learn to monitor that second tier will have a measurable edge over those still counting positions. Expect “AI citation share” to harden into a board-level KPI within the next few reporting cycles.
- We anticipate a freshness arms race on any query with a moving answer.
As recency proves itself a citation lever, update cadence and machine-readable “last updated” signals will shift from nice-to-have to table stakes, and stale evergreen pages will quietly fall out of the composed answers even where they still rank.
- We’re watching the interpretive layer keep rising as raw numbers commoditise.
When every portal supplies the same averages, the differentiator becomes forecast, context and judgement — which structurally favours expert and specialist publishers over sheer scale. That is the opening for challenger brands, and it will widen.
- And we’re tracking the move from answers to actions.
As agentic browsing matures — the territory our A.G.E.N.T. Framework workflows are built for — the question stops being “which page ranks?” and becomes “which source does the agent trust enough to act on?” The brands that structure their data, expertise and freshness for machine consumption now will be the ones agents choose later. Everyone else will be optimising for a click economy that has already moved on.
About Szymaniak Digital
Szymaniak Digital is a UK-based Enterprise AI SEO Consultancy helping enterprise and growth-stage brands win visibility in AI search – AI Mode, AI Overviews, and the agentic experiences coming next. Founded by Konrad Szymaniak, an enterprise SEO consultant, brightonSEO and MeasureFest speaker, university guest lecturer on Enterprise AI SEO and agent optimisation, and contributor to Semrush, Screaming Frog, Sitebulb and Majestic, the consultancy is built around a research-first, outcome-led approach to the search landscape as it is actually changing – not as it used to work.
If AI Mode is rewriting who gets seen & chosen in your category, we can help you map the fan-out, build the pages that earn citations, and measure your AI citation share as it grows.