
1. What happened? – Search Console Multi-Country and Device Filters: What International SEO Teams Need to Know
Google Search Console has updated the filters in the Performance report.
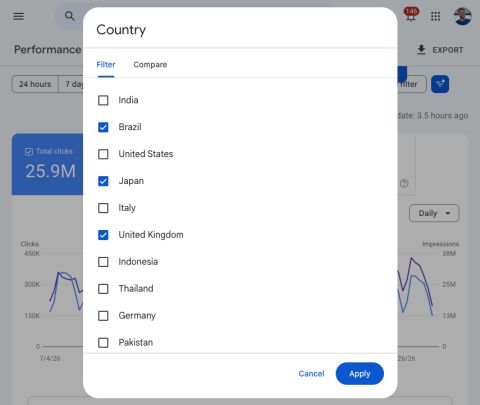
You can now select multiple countries or devices at the same time, which means businesses operating across several markets can view combined search performance in one report.
For example, you could select Brazil, Japan and the United Kingdom and see their Google Search traffic together.
There is also a Compare tab alongside the Filter tab.
On the surface, this looks like a simple usability improvement.
You no longer need to export the data to a spreadsheet or use the API just to look at several countries together.
That is useful.
But there is another consequence that is worth paying attention to.
Search Console calculates the combined numbers differently from most spreadsheets
When you combine countries, clicks and impressions can simply be added together.
CTR and average position are different.
You cannot just average the CTR from each country, and you should not simply average the average position either.
CTR needs to be calculated from the combined clicks and impressions.
Average position needs to be weighted by impressions.
That means the numbers you see in the new Search Console view may not match the numbers some businesses have previously reported.
Nobody necessarily made a mistake this week.
The problem may have been in the way the numbers were being combined before.
2. Why does this matter?
The spreadsheet calculation that causes problems
Take two markets:
| Market | Clicks | Impressions | CTR | Average position |
|---|---|---|---|---|
| United Kingdom | 1,000 | 50,000 | 2.00% | 8.0 |
| Brazil | 100 | 20,000 | 0.50% | 15.0 |
A simple spreadsheet might average the two CTR figures:
(2.00% + 0.50%) ÷ 2 = 1.25%
It might also average the two positions:
(8.0 + 15.0) ÷ 2 = 11.5
Both calculations are misleading.
The correct combined CTR is:
1,100 ÷ 70,000 = 1.57%
The combined average position, weighted by impressions, is:
((8.0 × 50,000) + (15.0 × 20,000)) ÷ 70,000 = 10.0
So the difference is significant.
The simple calculation makes the CTR look worse than it is and makes the average position look worse as well.
The bigger the difference in size between markets, the more this can matter.
Imagine a business with one very large market and six smaller markets.
If you simply average all seven positions, those smaller markets can have far more influence on the reported number than they should.
That is why businesses may suddenly see different figures when they use the new combined Search Console view.
This needs to be explained before it becomes a problem
Imagine your international marketing lead opens Search Console and sees a combined figure that is better than the number used in last quarter’s board report.
The obvious question will be:
Why have the numbers changed?
The answer is not necessarily that SEO suddenly improved.
The reporting method has changed.
It is worth explaining this to stakeholders before they ask.
The bigger opportunity: looking at groups of markets
Before this update, Search Console gave you a fairly limited choice.
You could look at one country at a time.
Or you could look at everything together.
Neither is particularly useful for large international businesses.
Looking at one country at a time makes every market feel isolated.
Looking at everything together gives you one large number dominated by your biggest market.
The useful question sits somewhere in the middle:
How is this group of markets performing together?
For example:
- Western Europe vs North America
- Markets with local offices vs markets managed centrally
- Your five biggest revenue markets
- Markets where you are actively investing
- Countries where you have traffic but no local SEO strategy
Those are much closer to the questions a CMO or marketing director actually asks.
Until now, answering them properly often meant exporting the data and building your own calculations.
Now you can do much more of this directly in Search Console.
Device filtering is more useful than it first appears
Google has three main device categories:
- Mobile
- Desktop
- Tablet
With multi-select, you can now compare mobile and tablet together against desktop.
That can be more useful than treating all three devices separately.
For many websites, the real distinction is between:
Touch-based browsing on smaller screens
and
Desktop browsing with a larger screen and a mouse or trackpad.
Tablet has often sat awkwardly between the two.
If you are making decisions about UX, page templates, site speed or conversion rates, testing mobile + tablet against desktop is worth adding to your reporting.
The filter got better. The data limitations did not.
This is the part I would pay most attention to.
A better interface does not mean Search Console has suddenly become a complete reporting system.
The existing limitations are still there.
The row limit is still there
Search Console only shows a limited number of rows in the Performance report.
Large websites can receive traffic from far more queries than the interface can display.
Selecting several countries together does not remove that limitation.
Anonymised queries are still missing
Google does not show some rare queries where displaying them could create privacy concerns.
The clicks and impressions can still appear in the overall totals, but the individual query may not appear in the table.
The data retention period is still limited
Search Console only gives you a rolling period of around 16 months.
That is fine for short-term reporting.
It is not enough for businesses that want to understand performance over several years.
Search Console still does not know your commercial data
Search Console does not know:
- Revenue
- Profit margin
- Stock levels
- Lead quality
- Market priorities
- Customer value
Those questions require you to connect search data with your wider business data.
So this update removes a workaround.
It does not remove the need for proper SEO reporting.
If you already have a BigQuery export or API reporting setup, keep it.
Measure how much of the data you can actually see
There is another issue that often gets overlooked.
Open a filtered Search Console report and compare:
Total clicks shown in the chart
with
The total clicks represented by the rows in the table.
They will often be different.
That happens because of the row limit and anonymised queries.
On a large site-wide report, the difference may not matter much.
On a small market or a narrow date range, it can matter a lot.
You could be making conclusions about a market based on only part of the available query data.
Use a coverage ratio
A simple way to check this is:
Table clicks ÷ chart clicks = coverage ratio
A high ratio means the query-level data is likely to give you a reasonable view of what is happening.
A low ratio means you are working with only a small part of the total data.
At that point, you have three sensible options:
- Widen the analysis
- Use the API or BigQuery
- Report the market at an aggregate level rather than making detailed query-level conclusions
The important thing is to know how much of the data you are actually seeing.
Grouping markets can also help
Combining several markets gives you more volume.
That can mean more queries appear in the table and the data becomes more useful for analysis.
That is a genuine benefit of the new feature.
3. Who is affected?
This update is most useful for businesses operating across multiple countries. And this is the type of client partnership Szymaniak Digital usually work with.
That includes businesses that actively target international markets and businesses that have simply ended up with international traffic.
A UK business might already receive meaningful traffic from:
- Ireland
- The United States
- The Gulf
- Europe
even if those markets were never part of the original SEO strategy.
Businesses with hreflang
This is particularly useful for websites with multiple international versions.
You can now start looking at whether your market groups actually perform well together.
For example, if you have five countries grouped together commercially but their search performance is completely different, that may tell you something about the strategy.
International ecommerce
International ecommerce businesses often have different:
- Prices
- Currency
- Shipping
- Stock
- Promotions
- Product availability
Your SEO reporting should follow the way the business is actually managed.
Businesses using ccTLDs or subfolders
Separate domains, subdomains or country folders can make international reporting awkward.
This update does not solve that completely, but it makes grouping markets within a property much easier.
Anyone reporting blended CTR or average position
This is the group most likely to see a noticeable difference in reported numbers.
If your current reporting averages CTR or position across markets, it is worth checking how those figures are being calculated.
Publishers
International publishers often have readers from many countries, but those countries are rarely looked at as groups.
SaaS and B2B businesses
A single English-language website might serve dozens of countries.
The new filtering makes it easier to see which markets are actually producing search demand.
Who is less affected?
Single-market businesses will get less value from the country filter.
Local businesses operating within one town, city or region are also less likely to benefit from the international grouping.
The device filter can still be useful.
4. What should businesses do?
There are four things I would recommend:
- Explain the reporting change before people notice it.
- Create one consistent way of grouping markets.
- Use those groups across your reporting.
- Check that your technical SEO setup supports the same market structure.
4A. Brief stakeholders before the numbers change
Do not wait for someone to ask why the numbers are different.
Send a short explanation.
Something like:
Search Console can now combine multiple markets more accurately. This means some of our previous combined figures may differ because our old reporting method averaged figures that should have been weighted. We are now using the combined Search Console figures going forward.
Then take one historical quarter and calculate it both ways.
Show the old calculation next to the new calculation.
That makes the difference easy to understand and gives everyone confidence in the new reporting.
Then agree which number becomes the official figure going forward.
Do not let different teams quietly go back to different spreadsheet calculations.
Check your reporting coverage
For every important filtered report, calculate:
Table clicks ÷ chart clicks
If the percentage is low, be careful about making conclusions from individual queries.
Do not cancel your BigQuery export
The interface has improved.
The underlying limitations have not.
4B. Create one market structure for the business
This is probably the most important operational step.
Create a market taxonomy and use the same structure everywhere.
Do not let one person group countries one way in Search Console and another person group them differently in a board report.
A simple structure could be:
Core markets
Markets with a local presence, local content and clear commercial targets.
Growth markets
Markets where the business is actively investing but has not yet reached scale.
Served markets
Markets where the website serves customers but there is limited dedicated investment.
Unserved markets
Countries the business does not actively target but still receive traffic.
These groups are useful because they answer different business questions.
A core market might be judged on total clicks, leads and revenue.
A growth market may be judged more heavily on growth rate and visibility.
A served market might be judged on efficiency.
Do not force every market to use the same success measure.
Look at your unserved markets
This is one of the most interesting reports to run.
Take every country you are not actively targeting and combine them into one group.
Then look at what is coming in.
You may find:
Real demand you are not targeting
A country may be producing enough traffic to justify dedicated content, local landing pages or a proper international strategy.
A technical or targeting problem
You may discover that the wrong version of your website is ranking in a country where you already have a local version.
Both findings are useful.
Before this type of filtering was available, this analysis was much harder to run quickly.
Make sure your commercial groups match your international SEO setup
Your business might organise markets by region.
Your hreflang implementation works using language and regional targeting.
Those structures need to make sense together.
For example, one Spanish-language page serving Spain, Mexico and Argentina may be fine in some cases, but it should be a deliberate decision rather than something that happened because the CMS was built that way.
The same applies to:
- Language targeting
- hreflang
- Canonicals
- Country folders
- Local landing pages
- Internal linking
- Conversion paths
Your reporting structure and your technical setup should tell the same story.
Compare market groups on CTR, not just position
Average position can be difficult to compare across countries.
Different markets have different:
- Competitors
- Search features
- SERP layouts
- AI-generated results
- Search behaviour
A position difference does not automatically mean one market has better or worse content.
CTR can sometimes give you a more useful comparison between groups.
Report trends by group, not just country by country
Small markets can be extremely noisy.
A market receiving 200 clicks a month can move dramatically from one month to the next without anything meaningful changing.
That is one reason grouping can be useful.
Instead of reacting to every small movement, look at the overall trend of the group.
This is much closer to how the business is actually managed.
4C. For development teams: make the market structure reusable
Once the market groups are agreed, do not rebuild them manually in every reporting tool.
Store them in one place and let your systems use the same structure.
That could feed:
- Search Console reporting
- Analytics segments
- Data warehouse queries
- Dashboards
- Forecasting
- SEO reporting
For example:
{
  "groups": {
    "core": {
      "label": "Core markets",
      "countries": ["GBR", "USA", "DEU", "FRA"]
    },
    "growth": {
      "label": "Growth markets",
      "countries": ["BRA", "JPN", "ESP", "ITA"]
    },
    "served": {
      "label": "Served markets",
      "countries": ["IRL", "NLD", "BEL", "AUT", "CHE"]
    }
  },
  "unserved": "*",
  "reviewed": "2026-10-06"
}
Keep this under version control.
That way, changing a country’s market group is a tracked change rather than another slightly different filter selection sitting in someone’s browser.
Check your hreflang implementation
Once you have your market groups defined, check whether your hreflang setup actually supports them.
Two common problems are:
- Missing return references
- Missing self-references
Each page in an hreflang cluster should reference the other pages in that cluster, including itself.
For larger websites, automate the checks rather than relying on manual inspection.
A basic validation process can check that:
- Every page references itself
- Every alternate URL exists
- Every alternate references the original URL
- Pages are actually part of the intended cluster
Also compare your market taxonomy with your hreflang targets.
Every country in a group should either have its own target or have a clear reason for being served by another version.
Be careful when mapping country codes
Search Console uses three-letter country codes.
hreflang uses two-letter regional codes.
Do not simply cut strings down to two letters and assume the result will always be correct.
Use a proper ISO country mapping table.
A quick shortcut may work for some countries but will fail for others.
Check x-default
Make sure your x-default points somewhere sensible.
It is the fallback for users in markets you have not explicitly targeted.
That makes the unserved-market analysis particularly useful.
You may find that the fallback page is receiving much more international traffic than expected.
Check hreflang and canonicals together
Your hreflang and canonical signals should not contradict each other.
For example, a page that declares itself as the version for one market but canonicalises to another market’s URL is sending mixed signals.
When making international technical SEO changes, give Google time to crawl and process them.
Avoid automatic geo-redirects for crawlers
Automatic redirects based on IP address can create serious problems for international SEO.
Googlebot may crawl from one region and end up seeing only one version of the website.
Make each market URL independently accessible.
Give users an obvious way to switch markets instead of forcing every visitor through an automatic redirect.
If redirects are necessary for users, make sure search engine crawlers can still access the individual market URLs.
Use the API or BigQuery for important reporting
The Search Console interface is useful for exploration.
It is not a replacement for proper data infrastructure.
For reporting that feeds business decisions, use the API or BigQuery where possible.
That gives you more control over:
- Historical data
- Market groupings
- Large datasets
- Commercial data
- Automated reporting
- Repeatable calculations
4D. How to roll this out
A sensible rollout would be:
- Explain the reporting change to stakeholders.
- Recalculate one historical quarter using both methods.
- Agree the market taxonomy with the commercial team.
- Put the taxonomy under version control.
- Update reporting to use the agreed groups.
- Run the unserved-market analysis.
- Check data coverage for each important market.
- Validate hreflang reciprocity and self-references.
- Compare market coverage against the agreed taxonomy.
- Rebuild reporting around groups rather than isolated countries.
- Review the market structure whenever the commercial strategy changes.
4E. Governance
Someone should own the market taxonomy.
The biggest risk is having five people use five slightly different versions of the same market structure.
That creates reporting which cannot be reconciled.
Keep one version.
Review it regularly.
Document how the calculations work.
For example:
Average position is impression-weighted. CTR is calculated from combined clicks and impressions.
One sentence can prevent the same spreadsheet error from coming back six months later.
Show the coverage ratio alongside filtered data
When you report a narrow market or query set, show how much of the overall click data is actually represented in the table.
A small coverage percentage should come with a warning.
Otherwise, people can make very confident decisions from a very small slice of the available data.
Keep the export and give it an owner
The Search Console interface getting better does not mean your wider reporting setup is no longer needed.
Keep the infrastructure that gives you:
- Longer-term history
- Larger datasets
- Query-level analysis
- Commercial joins
- Automated reporting
Give each market group the right KPI
For example:
Core markets: absolute performance
Growth markets: rate of growth
Served markets: efficiency
Using the same metric for every market can lead to the wrong decisions.
5. What we are watching next
The next question is whether Google expands this idea further.
Will multi-select work in Compare?
The Compare and Filter tabs are currently separate.
Being able to compare one group against another would be much more useful.
For example:
Core markets vs growth markets
or
Western Europe vs North America
Check your account to see exactly what is available, because this could become one of the most useful parts of the update.
Will grouping come to other dimensions?
Country grouping is useful.
But similar functionality for other dimensions could be even more valuable.
For example:
- Query groups
- Page groups
- Search appearance groups
Page grouping in particular could make technical SEO reporting much more useful.
Will Google introduce saved segments?
This is another obvious next step.
Multi-select is great until you have to tick the same 12 countries every Monday.
Saved, shareable segments would make it much easier to use a standard market taxonomy inside Search Console.
Will the row limit increase?
For large websites, this remains one of the biggest restrictions on interface-based analysis.
Increasing the number of visible rows would make many more reports useful without requiring an export.
How different are AI search results by country?
This is another area worth watching.
Different countries have different:
- SERPs
- Competitors
- Search behaviour
- AI Overview availability
- Search features
It will be interesting to see whether the impact of AI-generated search results and changes in CTR varies significantly between markets.
That could become a major international SEO reporting question.
6. About Szymaniak Digital
Szymaniak Digital is an enterprise AI SEO consultancy.
One issue we regularly see with international businesses is that their reporting structure does not match the way the business actually operates.
Markets might be grouped by language because that is how the CMS was originally built.
Or they might not be grouped at all because the reporting tools made it difficult.
Google’s latest Search Console update makes some of that analysis much easier.
But the real opportunity is bigger than simply ticking a few more boxes.
Businesses should be able to answer basic questions such as:
Which markets are actually driving demand?
Which markets are growing?
Where are we getting traffic without actively targeting it?
Are our international SEO setup and commercial strategy aligned?
Are we reporting the numbers correctly?
That is where international SEO reporting becomes useful to the wider business, rather than simply being another Search Console dashboard.
If your combined international figures are about to change, explain the change before someone else has to.
And if you have never looked properly at the markets you are not targeting, this is a good time to start. Need help with your international SEO reporting?