

1. What Happened? – Related Searches SERP Share: Related Searches Now Appear on 93.68% of UK Desktop SERPs
Our UK desktop SERP tracking for the 30 days to 2 October 2026 shows volatility of 8.4 out of 10 across all categories, which is firmly in the “very high” range.
The September 2026 spam update started on 24 September and Google said the rollout could take up to two weeks. That means much of the data in this report was collected while the update was still rolling out.
Most analysis of a Google update looks at which websites gained rankings and which lost them.
What stands out in our data is slightly different:
Google also changed what the search results page looked like.
Related searches dropped sharply, then came back
This is one of the clearest changes in the data.
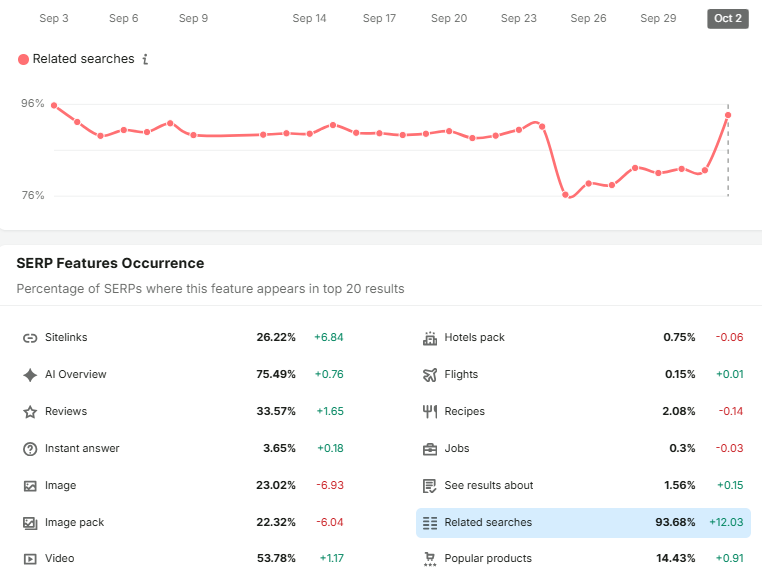
Related searches appeared on roughly 90% to 94% of UK desktop SERPs through early and mid-September.
Then, as the spam update began rolling out around 24 September, occurrence dropped sharply to around 78% and remained in the low 80s for about a week.
By 2 October, it had recovered to 93.68%, a net increase of 12.03 percentage points over the 30-day period.
A feature dropping this sharply and then recovering within days is not a normal gradual trend.
It could have been part of a Google test, or the rollout itself may have affected how the results page was being displayed.
We cannot tell which from the outside, so we should not pretend we know.
Another change happened at the same time
Related searches did not move on their own. Several other SERP features changed during the same period.
| Feature | Occurrence | Change |
|---|---|---|
| Related searches | 93.68% | +12.03 |
| Sitelinks | 26.22% | +6.84 |
| Video carousel | 25.44% | +2.81 |
| Reviews | 33.57% | +1.65 |
| Video | 53.78% | +1.17 |
| AI Overview | 75.49% | +0.76 |
| People also ask | 78.91% | −0.50 |
| Image | 23.02% | −6.93 |
| Image pack | 22.32% | −6.04 |
Image and image pack occurrence fell by almost 13 percentage points combined.
At the same time, related searches and sitelinks gained almost 19 points combined.
Looking at the relative change makes the movement even clearer:
- Image occurrence fell by roughly 23% from where it started.
- Image pack fell by roughly 21%.
- Sitelinks increased by around 35%.
This does not simply look like rankings changing.
It looks like Google was changing the mix of features shown on the UK desktop results page, with less space given to some visual features and more to search refinement and website navigation.
One important warning about the volatility figure
There is an important measurement issue here.
The volatility baseline across markets was recalculated on 18 September, six days before the September spam update started.
That means the 8.4 volatility figure crosses a change in the way the metric was calculated.
So when comparing volatility before and after 18 September, we may be looking at a mixture of:
- genuine changes in Google’s search results; and
- changes caused by the measurement formula.
That does not make the data useless, but it does mean we need to be careful when comparing scores across that date.
2. Why Does It Matter? – Related Searches SERP Share: Related Searches Now Appear on 93.68% of UK Desktop SERPs
Google is giving users more ways to continue searching without clicking away
It helps to group SERP features by what they encourage users to do.
Some features are designed to send users somewhere else, such as:
- Organic results
- Image results
- Image packs
- Video results
Others give users more information or help them continue their search inside Google:
- AI Overviews
- People also ask
- Related searches
- Knowledge panels
Now look at the UK desktop figures:
- Related searches: 93.68%
- People also ask: 78.91%
- AI Overview: 75.49%
That means almost 94% of UK desktop SERPs have a way for the user to refine or continue their search.
At the same time, both image features fell significantly.
The important point for SEO is that the search results page is doing more of the work itself.
For businesses that rely on organic traffic, that means ranking well is still important, but the amount of traffic available from a ranking can depend heavily on what Google puts around it.
Image visibility falling does not mean visual search is becoming less important
At first, there appears to be a contradiction.
Google has introduced multimodal reporting in Search Console covering things such as Lens, Circle to Search, image uploads and image search through Chrome.
Yet image and image pack occurrence fell on desktop.
Both things can be true.
One possible explanation is that visual search is increasingly happening through Lens and other visual search tools rather than traditional desktop image results.
That matters for SEO.
The goal should not simply be to appear in an image pack on a desktop SERP. Businesses also need to think about whether their images can be discovered and understood through Google’s newer visual search systems.
We cover this in our Google Lens SEO guide and our guide to Search Console multimodal reporting.
Sitelinks are becoming more common
Sitelink occurrence increased by 6.84 percentage points, reaching 26.22%.
That is roughly a 35% relative increase from the start of the period.
Sitelinks give a website more space on the results page, which can make the main result much more prominent.
This is especially important when a business already has a strong position for an important search.
It can also make life harder for competitors further down the page, because more of the available space is being taken by one result.
Sitelinks are also different from features such as AI Overviews because there are things websites can do to make their structure clearer to Google.
Clear navigation, good internal linking, descriptive page titles and a consistent site structure all help Google understand how the website fits together.
Related searches are one of the most underused sources of SEO data
This is probably the most practical takeaway from the data.
Related searches now appear on 93.68% of UK desktop SERPs.
That is more common than People also ask and more common than AI Overviews.
Yet many content teams spend a lot of time collecting People also ask questions while barely tracking related searches.
That is a missed opportunity.
Related searches show the other queries Google thinks are connected to the search someone has just made.
Used properly, they can help with:
- finding content gaps;
- planning new pages;
- improving internal linking;
- building content around related topics; and
- understanding how Google connects different subjects, brands and products.
They should not simply be treated as something sitting at the bottom of the SERP.
They can be a useful source of information about how search behaviour around a topic is changing.
Some categories were much more volatile than others
Volatility was not evenly spread across the categories we track.
Most volatile:
- Finance — 9.3
- Sports — 9.3
- Food & Drink — 9.2
- Internet & Telecom — 9.1
- News — 9.1
- People & Society — 9.1
- Real Estate — 9.1
Least volatile:
- Science — 5.7
- Shopping — 6.3
- Health — 6.8
- Hobbies & Leisure — 6.9
- Business & Industrial — 7.1
- Home & Garden — 7.3
Finance and Sports were jointly the most volatile categories in our data.
These are also categories where third-party commercial content is common, including comparison, betting, affiliate and other commercially driven content published across a wide range of websites.
News was also among the more volatile categories.
However, we cannot say the spam update specifically targeted these categories.
Google described the September update as a normal spam update applying its existing spam policies. It did not publish detailed information showing that particular categories were targeted.
What we can say is that these categories experienced more movement during our tracking period.
For businesses publishing third-party commercial content in these areas, that makes it worth reviewing what is being published, where it sits on the site and whether it provides genuine value.
SERP data collected during the rollout needs to be treated carefully
The related searches data makes the problem obvious.
We recorded approximately:
- 92% on 23 September
- 78% on 26 September
- 93.68% on 2 October
That is a very large change in a very short period of time.
So any SERP audit, competitor analysis or SERP feature report produced between 24 September and roughly 8 October may have captured a temporary version of the search results.
That does not mean the data is wrong.
It means it may not represent the final version of the SERP once the rollout has finished.
3. Who Is Affected?
Publishers and content websites
If your business depends heavily on organic traffic, the increasing number of SERP features matters.
When Google can answer part of a question directly, or encourage the user to search again without visiting a website, fewer users may reach the traditional organic listings.
Ecommerce and visually led businesses
The decline in image and image pack occurrence is particularly relevant to areas such as:
- fashion;
- homeware;
- food;
- travel; and
- other categories where images help drive discovery.
Visual search is still important, but businesses need to look beyond traditional desktop image results.
Finance, Sports, News and Real Estate
These were among the most volatile categories during the period we measured.
That does not prove they were specifically targeted by Google, but businesses operating in these markets should pay particularly close attention to ranking changes and changes to the types of content appearing in search.
Businesses competing with dominant brands
Higher sitelink occurrence can give established websites more space on the results page.
That means businesses trying to break into competitive search results may have less visible space available to them, even when their own ranking has not changed significantly.
Teams running SERP audits in late September
Your data may have captured a moving target.
This is particularly important when comparing screenshots, competitor reports or feature occurrence from before and during the update.
Anyone comparing volatility scores across 18 September
Be careful with the numbers because the baseline calculation changed on that date.
Content teams tracking People also ask but not related searches
Related searches were far more common in our UK desktop data.
If your SEO process only collects People also ask questions, you are missing another major source of search data.
Categories with lower volatility
Science and Shopping had much lower volatility than Finance and Sports during this period.
That does not mean they were unaffected by SERP changes. It simply means the amount of ranking movement we recorded was lower.
4. What Should Businesses Do?
The first priority is not to overreact to data collected during the rollout.
The second is to separate changes in your rankings from changes in the page around your rankings.
Those are two different problems and they need different responses.
4A. Everyone: Re-baseline after the rollout
Mark the update period.
Record 24 September to roughly 8 October as the September spam update period in your SEO reporting, Search Console and analytics.
This gives you useful context when looking back at performance later in the year.
Mark 18 September separately.
The volatility baseline changed on this date. Make sure anyone looking at the data knows this before comparing numbers across the period.
Repeat your SERP feature tracking after the rollout.
For your most important commercial searches, record which features appear and where they appear.
Do not just record rankings.
You need to know what the search results page looks like around your result.
Separate ranking changes from SERP layout changes.
For example, if your website stays in position three but Google removes an image pack above it, that is very different from your website falling from position three to position eight.
Both affect visibility, but for very different reasons.
Look at your own category.
An all-category volatility score of 8.4 does not tell you what happened in your market.
The difference between categories in our data was significant.
4B. For Content and Marketing Teams: Start Tracking Related Searches
This is one of the easiest things teams can start doing.
For every important search query, record the related searches that Google shows.
Save them with the date so you can compare them over time.
Use them to identify:
Content gaps
If related searches appear repeatedly but you do not have useful content addressing them, investigate whether there is a genuine gap.
Internal linking opportunities
Related searches can show how Google connects different topics.
This can help you think about how pages should link to one another.
Content hubs
If the same related searches keep appearing around several important queries, they may point towards a useful content group or topic area.
Entity and brand relationships
Related searches can also show which businesses, products and concepts Google commonly associates with a topic.
Track those relationships over time as well.
Track changes, not just the list
A related searches block that changes over time can tell you that Google’s understanding of a topic or the way users search for it may be changing.
That makes the data much more useful than simply copying the questions into a spreadsheet once.
Stop treating People also ask as the only free source of query data
People also ask is useful.
But in our data, related searches appeared on 15 percentage points more SERPs.
There is no reason to choose one over the other.
Use both.
Rethink your image strategy
Image and image pack occurrence both fell by roughly a fifth.
That does not mean image SEO is no longer important.
It means you should think about where your images can be discovered.
That includes visual search, product discovery and other Google surfaces rather than relying only on desktop image packs.
Create content for more specific searches
As Google gives users more ways to refine their searches, very broad content has more competition from Google’s own search features.
The opportunity is often in more specific searches:
- comparisons;
- “which one is right for me?” searches;
- product or service decisions;
- location-specific questions; and
- content that helps someone make a decision.
The goal is to answer the specific question a user is likely to ask next.
Review third-party commercial content
Finance, Sports and News were among the most volatile categories in our data.
If you publish third-party commercial content, review it carefully.
Look at whether it is useful, original and genuinely relevant to the audience rather than simply existing to capture search traffic.
4C. For Development Teams: Focus on the Features You Can Influence
Make your site structure easy for Google to understand
Sitelinks are influenced by the way your website is structured.
Focus on:
- clear navigation;
- logical site sections;
- consistent internal linking;
- descriptive page titles;
- useful breadcrumb navigation;
- consistent templates; and
- crawlable navigation that does not depend entirely on scripts.
For example:
{
  "@context": "https://schema.org",
  "@type": "BreadcrumbList",
  "itemListElement": [
    {
      "@type": "ListItem",
      "position": 1,
      "name": "Home",
      "item": "https://example.com/"
    },
    {
      "@type": "ListItem",
      "position": 2,
      "name": "Insurance",
      "item": "https://example.com/insurance/"
    },
    {
      "@type": "ListItem",
      "position": 3,
      "name": "Car Insurance",
      "item": "https://example.com/insurance/car/"
    }
  ]
}
Track SERP features as data
Do not rely only on screenshots.
Store feature data over time so that you can compare what changed.
For example:
serp_features (
  captured_at     DATE,
  query           STRING,
  market          STRING,   -- 'uk'
  device          STRING,   -- 'desktop' | 'mobile'
  feature         STRING,   -- 'related_searches' | 'ai_overview' | ...
  present         BOOL,
  position_block  INT64,
  our_presence    BOOL
)
The important field is our_presence.
Knowing that an AI Overview, related searches block or sitelink appeared is useful.
Knowing whether your business appeared in it is much more useful.
Keep your image infrastructure healthy
Even though desktop image features have declined, images still matter.
Make sure you are using:
- proper
imgelements; - stable image URLs;
- descriptive filenames;
- useful alt text;
- image sitemaps where appropriate;
- supported image formats; and
- structured data that points to the correct image.
Make sure Google can access your images
Visual search makes image accessibility even more important.
CDN rules, bot protection and other technical controls can sometimes prevent search engines from accessing images properly.
Check for blocked image requests, particularly if you use third-party CDNs or aggressive security settings.
Look at your own site’s search data
You cannot see exactly what someone searches for next on Google.
But you can see what people search for next once they arrive on your website.
Your internal site search data can therefore provide useful clues about what information visitors still need after landing on the site.
Many organisations collect this data but rarely use it.
4D. Rolling This Out
- Annotate the key dates: 18 September methodology change, 24 September update launch and roughly 8 October expected completion.
- Re-run your SERP feature tracking for your most important commercial searches after the rollout.
- Track whether you appear inside SERP features, not just whether the feature exists.
- Look at volatility for your own category, not only the all-category figure.
- Separate ranking changes from SERP layout changes in your reports.
- Start collecting related searches and store them with the date.
- Compare related searches with your existing content to identify gaps.
- Review your site structure and internal linking to improve your chances of earning useful sitelinks.
- Review how you are investing in image SEO, including visual search.
- Re-baseline your data in 30 days and compare it with the post-rollout results.
4E. What to Monitor
SERP feature occurrence
Track how often important features appear rather than only checking after a Google update.
Your presence within those features
There is a big difference between knowing that an AI Overview appears and knowing whether your business is cited in it.
The same applies to sitelinks, related searches and other features.
Large movements in individual features
A 12-point change in one feature over a month is worth investigating.
It may indicate a real change in how Google is building the results page.
Your own historical data
Industry-wide volatility can provide context.
Your own data tells you what is actually happening to your website.
5. What We’re Watching Next
Does the related searches recovery hold?
Related searches fell from around 92% to 78% and then recovered to 93.68% within days.
The next question is whether that recovery remains stable.
If it does, related searches may have become a near-permanent part of the UK desktop SERP.
If the figure falls back towards the high 80s, the September movement may have been temporary.
The next 30 days should make that clearer.
Does the decline in image features continue?
A drop of roughly six percentage points in both image and image pack occurrence is significant.
If that continues, it would suggest that Google is changing where visual discovery happens rather than simply reducing the importance of images.
That would make Google’s new multimodal reporting even more important for SEO teams.
Do sitelinks continue to increase?
If sitelinks continue to appear more often, websites already dominating important searches could continue to take up more space on the page.
That is worth monitoring when assessing competitive search visibility.
What happens with AI Overviews?
AI Overview occurrence reached 75.49%, but increased by only 0.76 points during the period.
The bigger question now may not be how often AI Overviews appear.
It may be:
What do they contain, which websites are they citing and which businesses are being included?
How will volatility tools handle methodology changes?
The tracking data we use had a baseline recalculation on 18 September.
That is an important reminder that volatility scores are measurements created by tools, not a universal standard.
When presenting these numbers internally, make sure you understand how the tool calculates the score and whether that calculation has changed.
6. About Szymaniak Digital
Szymaniak Digital is an enterprise AI SEO consultancy working with senior marketing teams and the development teams responsible for implementing SEO changes.
We track how search results are changing, separate ranking changes from changes to the SERP itself, and help businesses adapt their content, technical SEO and site structure around those changes.
Because ranking in position three means something very different when Google changes everything around position three.
If your SEO reporting tells you where you rank but not what the search results page looks like around you, you are only seeing part of the picture.