

Google has finally added a useful new report to Search Console for people who find websites using images.
Google says the update is designed to show “how your content is surfaced when users search using images”, including searches made through Google Lens, Circle to Search on Android, image uploads to Google Search and Chrome’s “Search this image” feature.
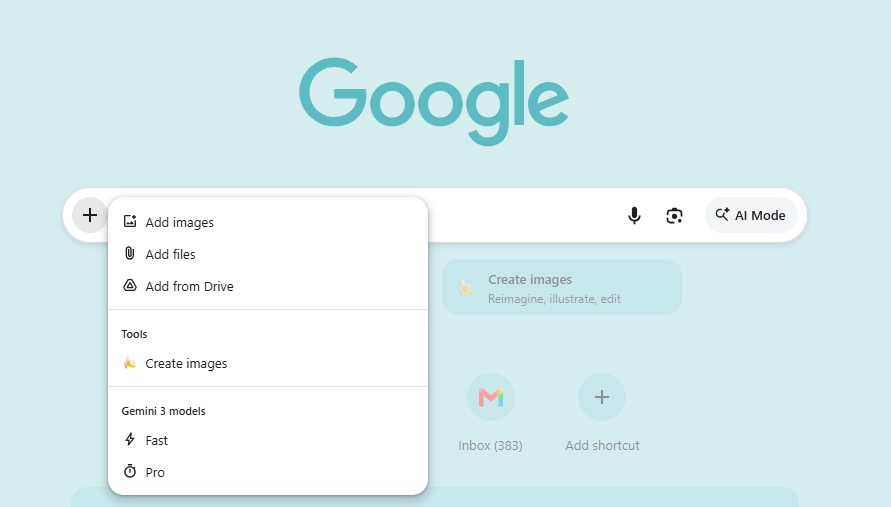
A new Web: multimodal search type lets you see this data in Search Console, and you can export it for further analysis.
That closes a measurement gap that has existed for years.
We previously wrote about Google Lens SEO and pointed out that there was no specific Lens report in Search Console. Image search data could give you a rough indication, but it was never a proper measure of how often people were finding your website through visual search.
That has now changed.
For the first time, businesses can put a number against this traffic.
But there is an important limitation that changes how you need to analyse it.
There are no search queries
This is the biggest thing to understand about the new report.
Google does not provide a search query for multimodal searches.
That makes sense.
If someone points their phone at a kettle, Google does not receive a typed search such as:
“red electric kettle 1.7 litre”
Instead, Google has an image and has to work out what the person is looking at.
So when you apply the multimodal filter in Search Console, the Queries report is not available.
Instead, you get:
- Pages
- Countries
- Devices
- Dates
- Clicks
- Impressions
- CTR
- Position
That changes how you need to think about the data.
Traditional SEO starts with the keyword.
This report does not.
Why Does Search Console Multimodal Reporting Matter?
The page becomes more important than the keyword
In normal Google Search, you might ask:
“Which keywords are we ranking for?”
With multimodal search, a better question is:
“Which of our pages does Google show when someone takes a photo of this product or object?”
That is a very different way of looking at SEO.
Imagine someone takes a photo of a pair of trainers in a shop.
Google has to work out what the product is and which websites have the most useful page for it.
If your product page appears, great.
But what if your category page appears instead?
Or an old product page?
Or a blog article?
Or a reseller?
Or nothing from your website at all?
That can tell you something much more useful than a normal keyword ranking.
It can show whether Google properly understands your products and whether the right page is connected to them.
For SEO teams used to working from keyword reports, this requires a change in mindset.
Your existing SEO dashboard probably starts with queries.
This data does not.
One Report Combines Four Very Different Types of Search
This is probably the most important part of the new data.
Google’s multimodal report combines several different ways of searching with an image.
They do not all mean the same thing.
Google Lens
Someone is physically looking at an object and using their phone camera.
They could be:
- In a shop
- In a friend’s home
- In a hotel
- Looking at something they have seen in real life
For retailers, this could be a very strong buying signal.
Circle to Search
This is particularly interesting.
Someone is already looking at something on their phone — perhaps in Instagram, TikTok, YouTube, a message or another app.
They circle the product or image and search for it.
That means you are potentially reaching someone before they have decided where to buy.
For example, someone sees a jacket in a creator’s video, circles it and searches.
If your product page appears, you have a chance to capture that demand.
This also means your social activity and your visual search performance can be connected.
Image uploads to Google Search
This is a more deliberate type of search.
Someone might upload:
- A screenshot
- A saved image
- A photograph they took earlier
- An image from a supplier
They could be trying to identify something or find somewhere to buy it.
Chrome “Search this image”
This is generally a desktop behaviour.
Someone right-clicks an image and searches for it.
That could mean they are trying to:
- Find the original source
- Find another website using the image
- Identify the photographer
- Find a product
- Check where an image came from
For publishers, photographers and brands, this is not necessarily a shopping signal at all.
It may be much more useful as a way of understanding where their images are appearing across the web.
One Number Does Not Tell You Everything
The problem is that Google currently puts all of these behaviours into one multimodal figure.
That is useful for understanding the overall size of the channel.
But it does not tell you exactly why people are searching visually.
At the moment, device is the closest thing you have to a useful clue.
Mobile traffic is more likely to include camera searches and Circle to Search.
Desktop traffic is more likely to include image uploads and right-click image searches.
It is not a perfect solution.
But for now, it is the best segmentation available.
First: Find Out Whether Your Numbers Have Changed
There is another important question that businesses need to answer before reporting this data.
Was multimodal traffic already included in your Web totals?
This matters because it could affect your historical reporting.
Reports on the rollout suggest Google has said this data was not previously shown separately.
But it is not completely clear from the reporting whether multimodal traffic was already included in the overall Web totals.
That creates two possible scenarios.
Scenario 1
Multimodal traffic was already included in Web.
In that case, Google has simply given you a way to filter it.
Your historical Web numbers remain comparable.
Scenario 2
Multimodal traffic has now been added to Web totals.
In that case, you may see Web impressions and clicks increase around the end of September even though your SEO performance has not actually improved.
That would be a reporting change rather than a traffic gain.
So before anyone reports a big Q4 increase, check what has happened in your own Search Console data.
The Timing Matters Too
The multimodal report appeared at almost exactly the same time as Google’s September 2026 spam update.
The spam update started on 24 September 2026 and was expected to take around two weeks to complete.
That is a long rollout compared with some recent Google updates.
So late-September and early-October data may contain two different changes at the same time:
- Google changed how this search data can be reported.
- Google was running a major spam update.
That makes it much harder to explain changes in performance data during this period.
So mark these dates in your analytics and reporting systems now.
Otherwise, you could end up debating the cause of a Q4 traffic change several months from now without being able to prove what actually happened.
Enterprise Teams Have Another Problem
There is a specific issue that matters much more to large organisations.
The Search Console API does not currently provide a multimodal search type in the same way as the Search Console interface.
That means enterprise teams may not be able to automatically pull this data into:
- BigQuery
- Looker
- Power BI
- Internal SEO dashboards
- Data warehouses
For a smaller business, this is annoying.
For a large enterprise, it is a real measurement problem.
The teams that need this data most are often the teams least likely to work directly inside the Search Console interface.
For now, manual exports may be necessary.
When API support becomes available, the transition should be straightforward if you have already built your reporting structure around the same fields.
Visual Search Is Now Measurable
This is the biggest commercial opportunity in the update.
For years, SEO teams could make a very good case for improving image SEO.
We have recommended things such as:
- Using real
<img>elements - Keeping image URLs stable
- Using descriptive filenames
- Writing useful alt text
- Creating image sitemaps
- Making images accessible to Google
- Using the correct structured data
- Making sure important products have strong images
The problem was that it was difficult to prove exactly how much traffic these improvements generated.
That has changed.
You can now measure multimodal impressions and clicks.
That makes visual search much easier to explain to stakeholders.
Instead of saying:
“We think better image SEO will help.”
You can eventually say:
“These are the pages people are finding through visual search, this is how much traffic they generate, and this is what happened after we improved them.”
That is a much stronger business case.
Who Is Most Affected?
Retailers and DTC brands
This is probably the clearest opportunity.
Think:
- Fashion
- Footwear
- Furniture
- Homeware
- Beauty
- Eyewear
- Plants
- Food and drink
These are categories where customers naturally use images to identify products.
Businesses with lots of Android users
Circle to Search is built into Android.
That makes it particularly relevant in markets where Android has a large share of smartphone use.
Brands with a strong social presence
This could become especially interesting for brands working with influencers and creators.
Someone sees a product in a social post.
They search for it visually.
Your website appears.
That means social content can become an entry point into Google Search without the customer ever typing the product name.
The social team and SEO team therefore have a new reason to work together.
Publishers, photographers and image owners
For these businesses, the data may be less about sales and more about understanding how their images are being found and reused.
A rise in desktop image-search activity could help identify where your visual assets are gaining attention elsewhere online.
Manufacturers selling through retailers
Suppose someone photographs your product.
Google shows five reseller websites but not your own site.
You now have measurable evidence that Google recognises the product but is not choosing your website.
That could support the case for improving your direct-to-consumer presence.
Who is less affected?
A B2B service company with no physical products and very little visual content is likely to see much lower volumes.
Even then, the technology still applies to:
- Diagrams
- Charts
- Research graphics
- Report images
- Illustrations
What Should Businesses Do?
The first stage should be measurement.
Do not start by changing your entire image strategy.
First, find out what Google is already showing.
And do it soon.
Search Console only keeps a limited amount of historical data, so the sooner you create a baseline, the more useful that historical record will become.
1. Export the Data Now
Start with the longest date range available in Search Console.
Apply the multimodal filter and export the data.
Keep the original file.
Put the date on it.
This may become the earliest baseline you have for this channel.
Do not assume Google will eventually give you historical data going back years.
2. Find Out Whether Web Totals Changed
This should be one of the first checks you make.
Compare daily Web impressions and clicks for roughly eight weeks before and after 24 September 2026.
Then compare them with the multimodal figures.
You are looking for a sudden change in the overall Web totals.
If the Web total jumps around the launch date while everything else remains stable, you need to investigate whether this is a reporting change.
Write down your findings.
Add the date to your analytics notes.
Do this before anyone starts using the new numbers in management reports.
3. Check How Far Back the Data Goes
Set Search Console to the earliest date available with the multimodal filter.
See when the data actually begins.
You may have historical data.
Or you may be starting from scratch.
That makes a huge difference when you eventually want to compare year-on-year performance.
4. Mark the Spam Update in Your Reporting
Add 24 September 2026 and the following rollout period to your analytics annotations.
Any major change during that period could have several possible explanations.
Make sure future reports make that clear.
5. Segment by Device
Because Google does not give you the original search method, device is currently your best clue.
Look at:
- Mobile
- Desktop
- Tablet
Then watch how that mix changes over time.
You may find that one device produces most of your multimodal traffic.
6. Stop Looking for Keywords
This sounds obvious, but it will probably be the biggest reporting adjustment for SEO teams.
There are no queries.
So do not build a report around keywords that you cannot obtain.
Instead, start with:
Which pages are getting impressions?
Then ask:
What does each page represent?
For ecommerce, connect the page back to the product.
7. Check Whether Google Is Showing the Right Page
This is where the data becomes really useful.
Imagine your top-selling product receives 5,000 multimodal impressions.
But the page receiving those impressions is a category page.
That tells you something.
Google understands the general product type but may not be connecting the visual search to the specific product page.
Other common examples include:
A category page appears instead of the product
The product page may not contain enough information or useful imagery to distinguish the product clearly.
A blog article appears instead of a commercial page
Google may understand the topic but not the correct page to send the user to.
An old product appears
Google may still associate the image with an old product URL rather than your current product.
Nothing from your website appears
That is potentially the biggest gap.
Google is recognising the object, but your website is not being selected.
8. Look at Your Highest-Value Products
Do the analysis backwards.
Take your top 100 products by revenue.
Then ask:
Which of these products appear in the multimodal report?
And:
Which ones do not?
The products missing from the report become a very useful priority list.
In many cases, the problem will not be a lack of written content.
It could be:
- Weak product photography
- Images that Google cannot access
- Poor image URLs
- Missing image information
- Poor page structure
- Confusing product data
- Duplicate or outdated images
9. Look at Impressions and CTR Together
A product with high multimodal impressions and very low CTR is worth investigating.
Google is showing it.
People are not clicking.
That could mean the page is not attractive enough in the result.
The image Google is using might be:
- Poor quality
- Too small
- Misleading
- Visually similar to other products
- Showing the wrong part of the product
In that situation, improving the photography may be more valuable than rewriting the product description.
10. Connect Visual Search With Social Media
Circle to Search makes this particularly interesting.
Someone sees your product on Instagram or TikTok.
They do not search for the brand.
They circle the product.
Google finds your product page.
That creates a connection between:
Social → Visual Search → Website → Sale
Your social team may currently measure reach, views and engagement.
Your SEO team may measure clicks and rankings.
Now there is another question:
When people see our products in social content and search for them visually, do we appear?
That is a useful conversation to have across teams.
11. For Publishers and Image Owners, Look at Desktop Data Differently
For publishers, photographers and image-heavy businesses, not every visual search is a shopping opportunity.
Some people are trying to find the original image.
They may be checking:
- Where an image came from
- Who created it
- Where else it has appeared
- Whether it has been reused
So an increase in desktop multimodal traffic may be useful information about how your images are travelling across the web.
What Developers Should Do
Build a regular export process
Until API support improves, create a simple manual process.
For example, export the same fields on a regular schedule and store them in one table.
A basic structure could be:
multimodal_performance (
  date            DATE,
  page            STRING,
  country         STRING,
  device          STRING,
  clicks          INT64,
  impressions     INT64,
  ctr             FLOAT64,
  position        FLOAT64,
  export_run_at   TIMESTAMP,
  source          STRING
)
The important thing is consistency.
When API support becomes available, you should be able to change the way you collect the data without rebuilding the entire reporting system.
Connect Search Console Data to Product Data
The real value comes when you connect multimodal performance to the rest of your business data.
For example:
Search Console page → Product → Images → Revenue
Then you can answer questions such as:
- Which products get the most visual search exposure?
- Which products get impressions but no clicks?
- Which high-revenue products have no visual search visibility?
- Which product categories are growing?
- Which image improvements led to more traffic?
That turns the Search Console report into something useful for prioritising work.
Fix the Image Infrastructure
The fundamentals still matter.
Make sure your important images are:
- Real
<img>elements rather than only CSS background images - Accessible to Google’s crawlers
- Available through stable URLs
- Properly named
- Supported by useful alt text
- Included in image sitemaps where appropriate
- Using the correct file format
- Referenced correctly in structured data
For ecommerce, make sure structured data points to the main product image rather than a tiny thumbnail.
Check That Google Can Actually Access Your Images
This is one of the easiest things to overlook.
If Google cannot fetch the image, it cannot use it.
Check for:
- CDN restrictions
- Access controls
- Robots blocking
- Broken image URLs
- Migration issues
- Incorrect file types
- Hotlink protection
- Template changes
A website can have beautiful photography and still get no visual search traffic if Google cannot access the files.
Monitor Multimodal Search Like Any Other SEO Channel
Once you have a baseline, add multimodal performance to your monitoring.
A sudden fall in impressions could indicate:
- A CDN change
- A website migration
- A new template
- Broken image URLs
- Changes to image handling
- Product page changes
This gives you another way to spot technical problems before they become much bigger.
A Practical Rollout Plan
For a large website, I would approach it in this order:
- Export all available multimodal data.
- Archive the original files.
- Check whether overall Web totals changed.
- Record the findings.
- Mark the September spam update in your reporting.
- Start regular exports.
- Connect the data to products and revenue.
- Identify your highest-value products with no multimodal visibility.
- Audit those product pages and images first.
- Fix templates before manually fixing thousands of individual pages.
- Improve photography where photography is the actual problem.
- Review performance again after 90 days.
The important point is to start with the pages that matter commercially.
Do not spend three months improving low-value image assets while your top products are invisible.
Reporting and Governance
Do not hide multimodal search inside your normal organic traffic number.
Give it its own line in your reporting.
It is a different type of search, and it does not have the query data that normal organic search has.
Useful KPIs include:
- Impressions
- Clicks
- CTR
- Top landing pages
- Device split
- Visibility across your priority products
- Revenue from pages receiving multimodal traffic
Be careful with average position.
Because this report combines several different behaviours, the number is much less useful than it is in a normal keyword report.
Also, give someone ownership.
This sits somewhere between:
- SEO
- Ecommerce
- Development
- Creative
- Social media
- Analytics
That usually means it becomes everyone’s responsibility and nobody’s responsibility.
Give it a clear owner.
What We Are Watching Next
Search Console API support
This is probably the most obvious next step.
Enterprise reporting will be much easier once multimodal search can be pulled automatically into existing data systems.
Better separation between search types
At the moment, Google combines different types of visual search into one report.
Being able to separate:
- Google Lens
- Circle to Search
- Image uploads
- “Search this image”
would make the data much more useful.
Each behaviour has a different business meaning.
More clarity around Web totals
The industry still needs a clear answer on whether multimodal traffic was already included in overall Web figures.
That matters for year-on-year reporting.
Visual search and AI search moving closer together
Google’s newer search experiences are becoming increasingly multimodal.
People are no longer just typing a question into search.
They can show Google an image and ask about it.
They can combine text and images.
They can search from what they are currently looking at.
The line between traditional search, visual search and AI search is getting thinner.
That will make measurement increasingly important.
The first useful benchmarks
There are not yet strong industry benchmarks for multimodal search.
That will change.
Agencies, vendors and large brands will eventually start publishing data about how much visual search traffic they receive.
Businesses that start collecting their own data now will have something much more useful:
their own history.
They will be able to judge future benchmarks against what actually happens on their websites.
What This Means for Enterprise SEO
Google has finally given businesses a way to measure something SEO teams have been talking about for years.
Visual search is no longer completely invisible.
But the way you measure it is different from normal search.
There are no keywords.
There is no traditional query report.
And one multimodal number combines several very different types of behaviour.
That means the first job is not to build a fancy dashboard.
It is to understand what the data actually represents.
Then connect it to the pages, products, images and revenue that matter to the business.
The most useful question for an ecommerce brand is now very simple:
When someone points a camera at our product, does Google show us?
And until now, most businesses had no way of answering that.
They do now.
About Szymaniak Digital
Szymaniak Digital is an Enterprise AI SEO consultancy working with senior marketing teams and the development teams responsible for their websites.
We help businesses measure new search channels, understand which pages and products are being surfaced, improve the technical foundations behind visual search and turn new Search Console data into a clear SEO roadmap.
If people can find your products by typing their names into Google, but you have no idea what happens when they point a camera at them, that is now something you can measure.
Book a Visual Search Audit. Contact Us!